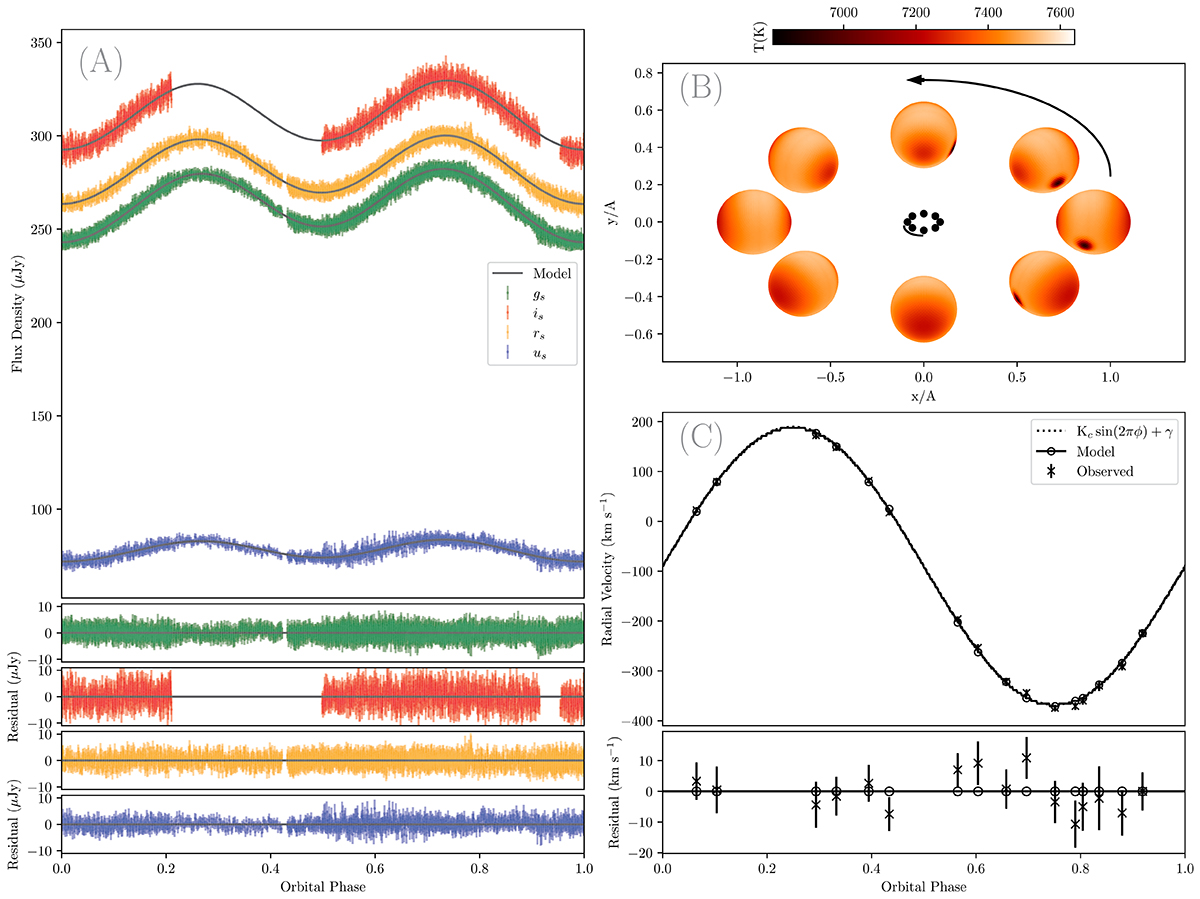
Fig. 6.
Download original image
Panel A: ULTRACAM light curves shown with different colours fitted with the DH model and a cold spot overlaid with solid black lines. Residuals are shown in the lower panels. Panel B: Surface temperature map along the orbit. Panel C: Observed radial velocity curve of J1431 obtained by Strader et al. (2019) (black dots) and the ones predicted by the model (empty dots) connected with a solid line together with a sinusoidal fit (dotted line). Residuals are displayed in the lower panel. Here phase zero is the inferior conjunction of the companion star.
Current usage metrics show cumulative count of Article Views (full-text article views including HTML views, PDF and ePub downloads, according to the available data) and Abstracts Views on Vision4Press platform.
Data correspond to usage on the plateform after 2015. The current usage metrics is available 48-96 hours after online publication and is updated daily on week days.
Initial download of the metrics may take a while.