Fig. 3.
Download original image
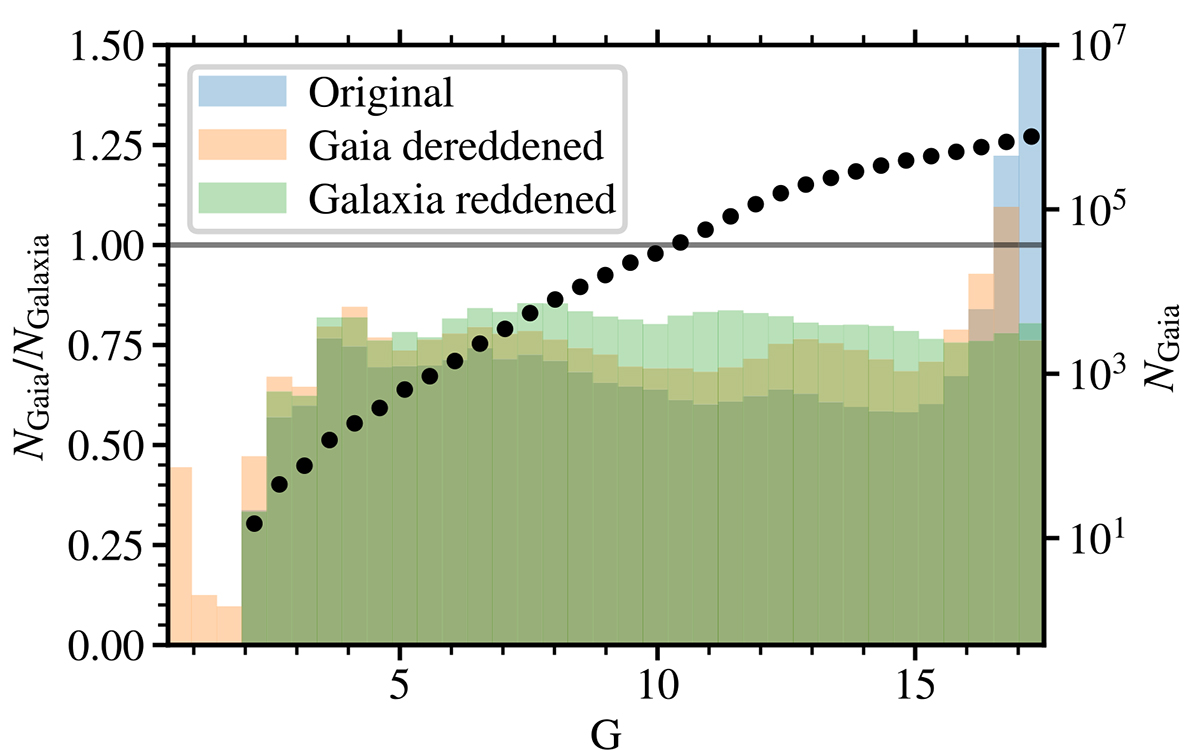
Completeness of the GALAXIA simulation versus the Gaia star counts. Histograms show the number of stars per magnitude bin in the region of NGC 2516. Blue shows the distribution when no reddening correction is done to the apparent magnitudes. Orange is the distribution when Gaia’s magnitudes are corrected for Gaia’s extinction, and Green is when GALAXIA absolute magnitudes are converted to apparent magnitudes with GALAXIA’s extinction taken into account. We used the latter magnitudes in this study. Points together with the axis on the right show the number of stars in Gaia per magnitude bin downloaded in the region of this cluster.
Current usage metrics show cumulative count of Article Views (full-text article views including HTML views, PDF and ePub downloads, according to the available data) and Abstracts Views on Vision4Press platform.
Data correspond to usage on the plateform after 2015. The current usage metrics is available 48-96 hours after online publication and is updated daily on week days.
Initial download of the metrics may take a while.