Fig. C.4.
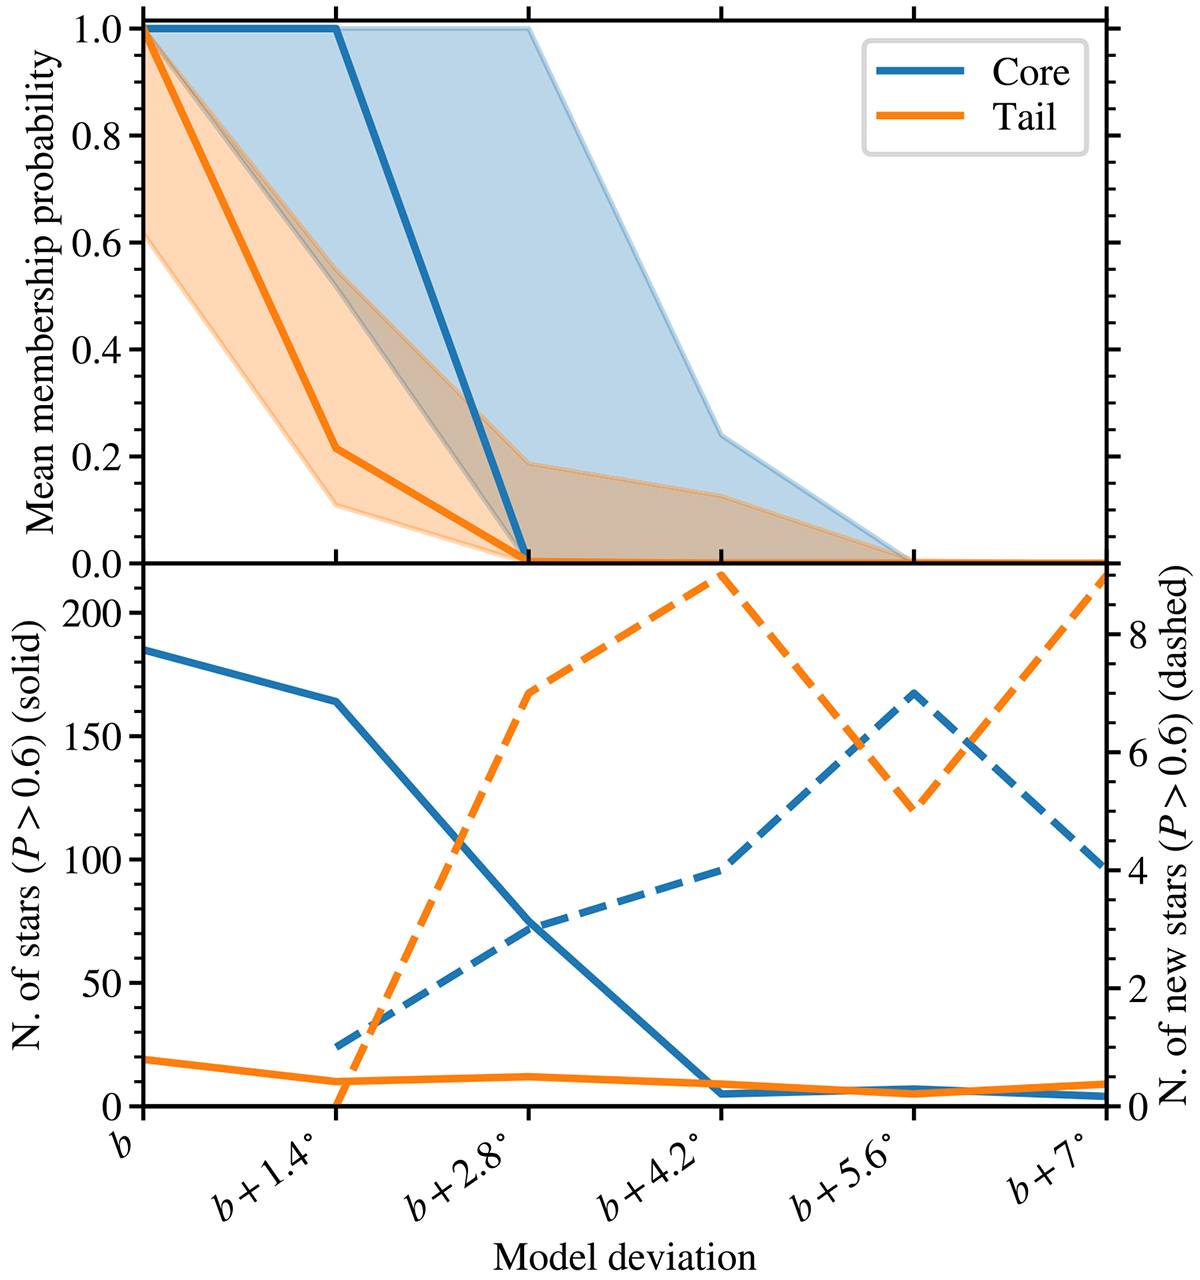
Download original image
Star counts and membership probabilities in the core and tails of cluster Collinder 350 if simulated with different positions of the cluster. Top: Mean membership probability of stars that have membership probability P > 0.6 in our original calculation after recomputing them with different cluster models. Shades show 16th and 84th percentiles and the silid lines show the 50th percentile. Bottom: Number of stars with P > 0.6 in the core (blue) and tails (orange) is shown with solid lines for the original cluster model and five different deviations from the model. Dashed lines show the number of stars that do not appear in the selection made with the original cluster model. All models deviated from the original in the position of the cluster centre in galactic latitude.
Current usage metrics show cumulative count of Article Views (full-text article views including HTML views, PDF and ePub downloads, according to the available data) and Abstracts Views on Vision4Press platform.
Data correspond to usage on the plateform after 2015. The current usage metrics is available 48-96 hours after online publication and is updated daily on week days.
Initial download of the metrics may take a while.