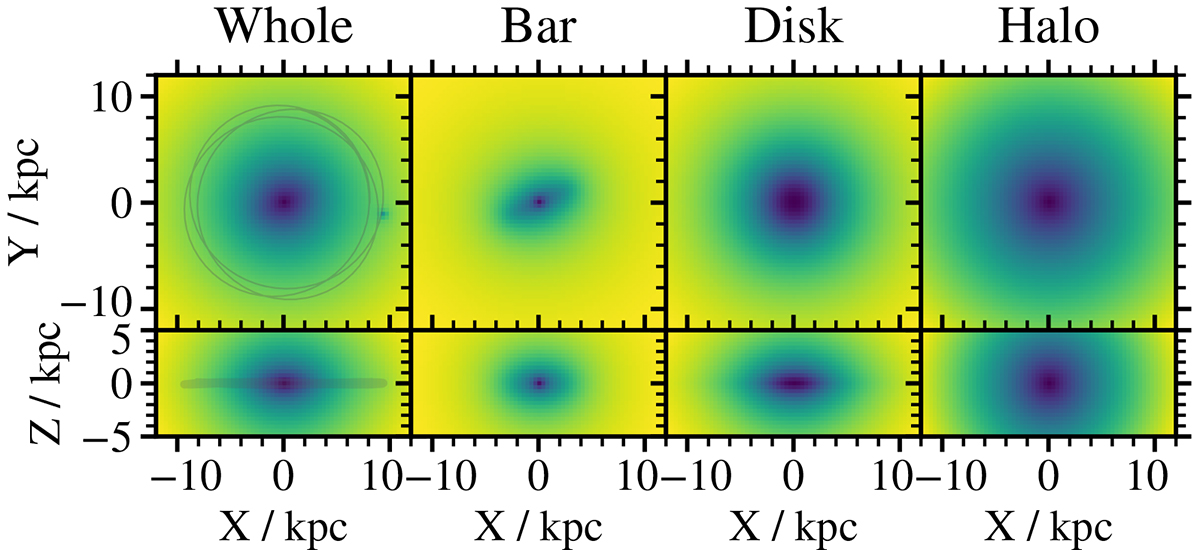
Fig. 1.
Download original image
Illustration of Galactic potentials used in the simulation of stellar orbits. The left column shows the complete gravitational potential, and the following columns show the potential of the bar, disc and the halo. The black line shows the orbit of the Sun for the last 750 Myr. A small dip close to the present position of the Sun is the gravitational potential of a simulated cluster, amplified one million times. Magnitudes of different potentials are not plotted to scale.
Current usage metrics show cumulative count of Article Views (full-text article views including HTML views, PDF and ePub downloads, according to the available data) and Abstracts Views on Vision4Press platform.
Data correspond to usage on the plateform after 2015. The current usage metrics is available 48-96 hours after online publication and is updated daily on week days.
Initial download of the metrics may take a while.