Fig. 5
Download original image
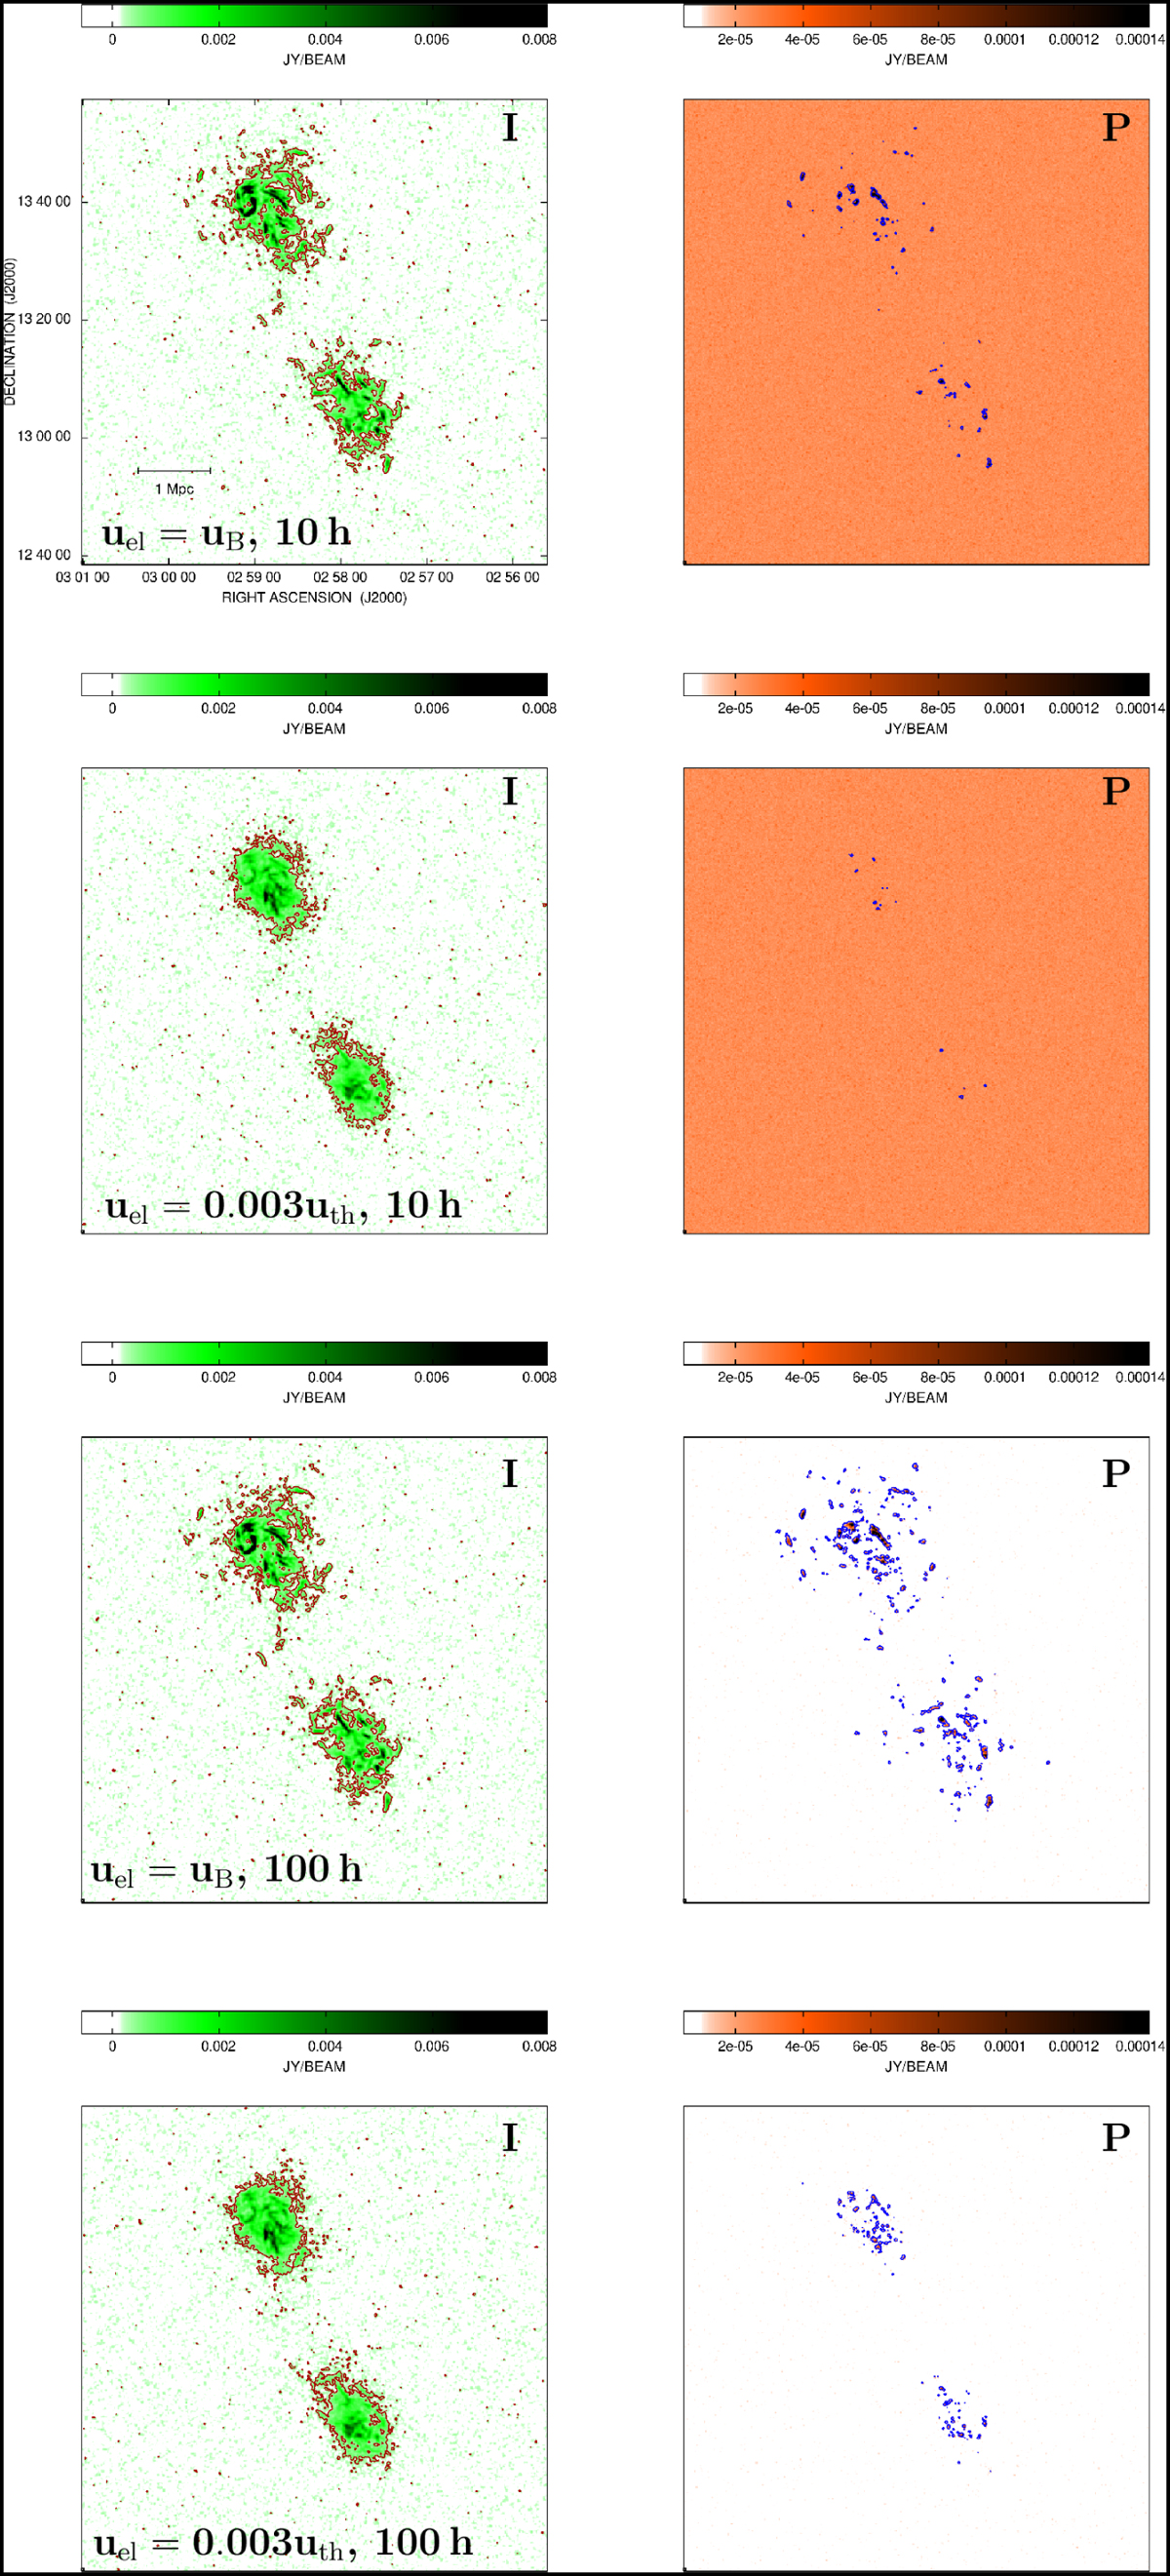
Total intensity (left) and polarised (right) surface brightness images expected from observations in the frequency range of 110–166 MHz and with a spectral resolution of 45 kHz with the SKALOW telescope, smoothed to a resolution of 20″. Red contours represent the 3σI, and blue contours the 5σP sensitivity expected after 10 h and 100 h. The FWHM is shown in the bottom left of each image. The simulated diffuse radio emission was obtained assuming a magnetic field and a thermal gas density distribution simulated by Xu et al. (2012) and a relativistic electron population in equipartition with the magnetic field (first and third row) and with an energy density equal to 0.3% of the thermal one (second and fourth row); see the text for more details.
Current usage metrics show cumulative count of Article Views (full-text article views including HTML views, PDF and ePub downloads, according to the available data) and Abstracts Views on Vision4Press platform.
Data correspond to usage on the plateform after 2015. The current usage metrics is available 48-96 hours after online publication and is updated daily on week days.
Initial download of the metrics may take a while.