Fig. 4
Download original image
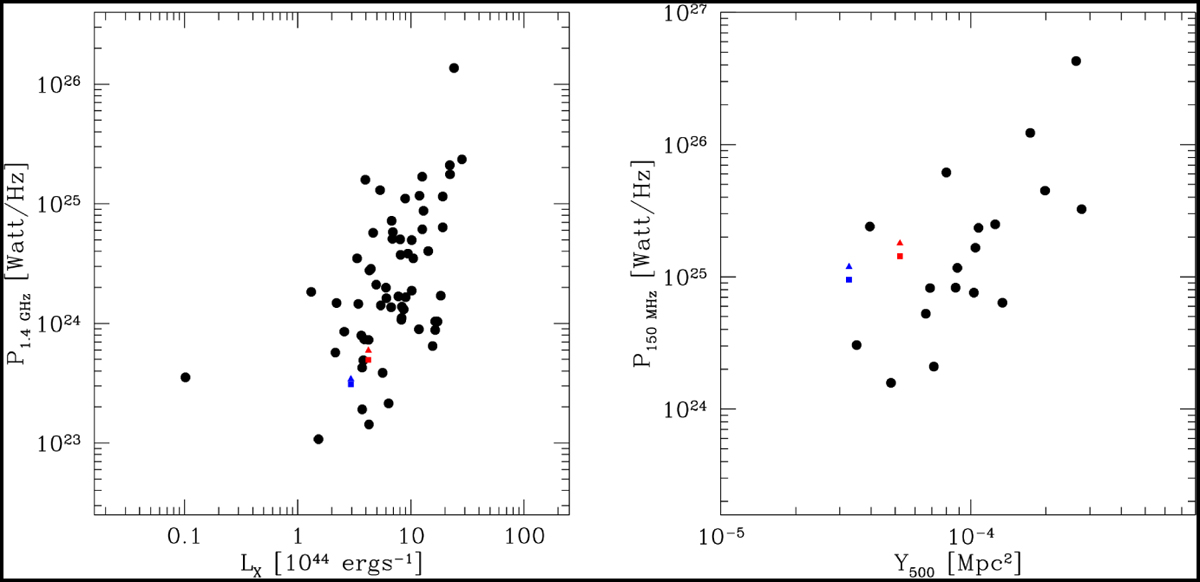
Observed radio, X-ray, and Compton parameter correlations. Left-hand panel: radio power at 1.4 GHz versus the X-ray luminosity in the 0.1–2.4 keV energy range. The data are measurements for radio halos revealed through pointed interferometric observations at about 1.4 GHz and are the same as are shown in Loi et al. (2017), plus the new halos from Giovannini et al. (2020). Right-hand panel: radio power at 150 MHz vs. the Compton parameter. The data are the literature measurements for radio halos revealed through pointed interferometric observations at about 150 MHz reported by van Weeren et al. (2021). In both plots, the values for the galaxy clusters C1 and C2 have been shown, respectively, in red and in blue, with triangles when derived assuming equipartition between magnetic field and relativistic electrons at each point of the computational grid and with squares when assuming a coupling between the relativistic and thermal electrons.
Current usage metrics show cumulative count of Article Views (full-text article views including HTML views, PDF and ePub downloads, according to the available data) and Abstracts Views on Vision4Press platform.
Data correspond to usage on the plateform after 2015. The current usage metrics is available 48-96 hours after online publication and is updated daily on week days.
Initial download of the metrics may take a while.