Fig. 3
Download original image
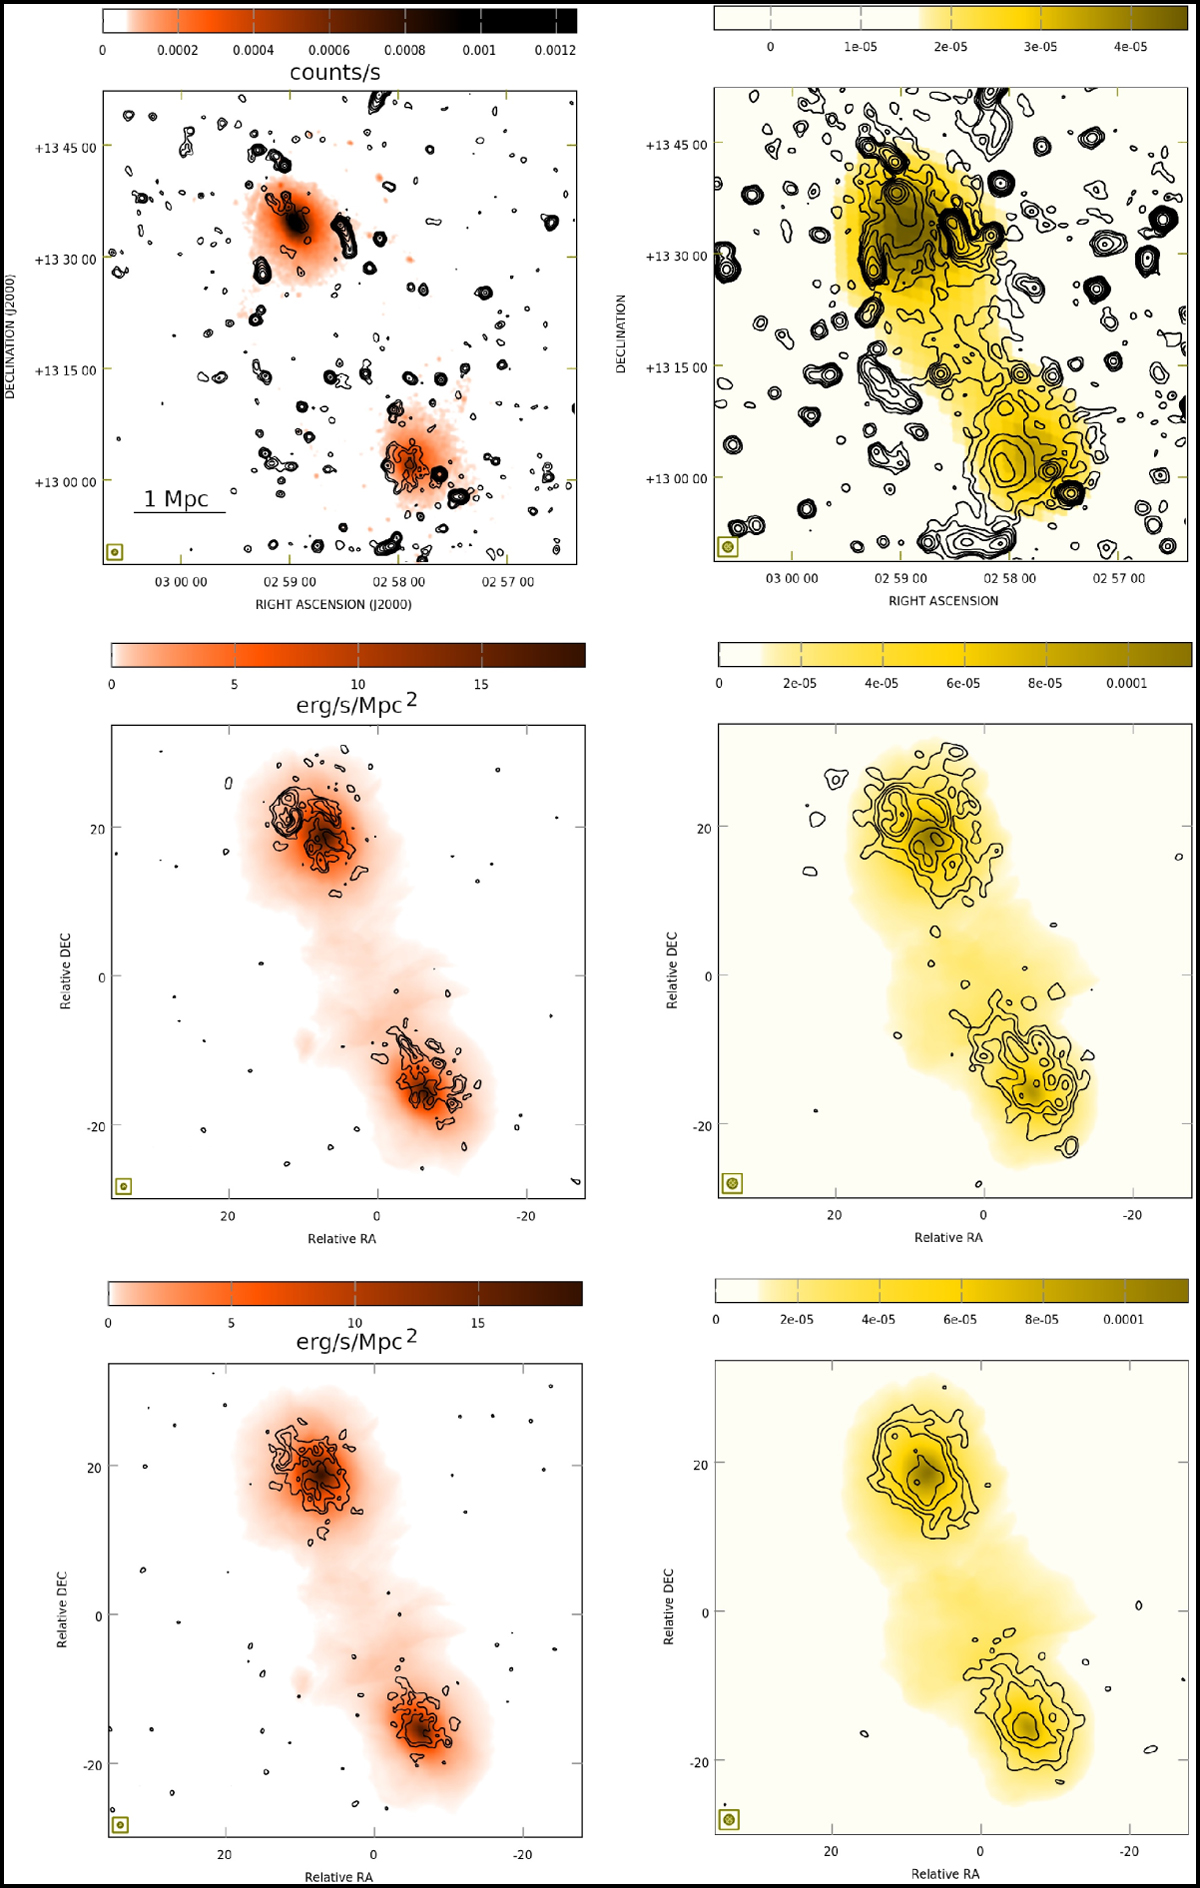
Radio, X-ray, and Compon parameter observations vs. simulations. Top row: observations of the galaxy cluster pair A399–A401, with radio contours at about 1.4 GHz over-imposed on the X-ray images in the band 0.2–12 keV in red colors (Murgia et al. 2010) on the left, and radio contours at about 150 MHz (Govoni et al. 2019) over-imposed on the Compton parameter images in yellow colors (Hincks et al. 2022) on the right. Middle row: same as top row, but produced from the simulations presented in this work, assuming equipartition between magnetic field and relativistic electrons at each point of the computational grid. Bottom row: same as top row, but produced from the simulations presented in this work, assuming a coupling between the relativistic and thermal electrons. In the left panels, contour levels start at 120 μJy/beam and increase by factors of two, with a spatial resolution of 45″. In the right panels, contour levels start at 3 mJy/beam and increase by factors of two, with a spatial resolution of 80″.
Current usage metrics show cumulative count of Article Views (full-text article views including HTML views, PDF and ePub downloads, according to the available data) and Abstracts Views on Vision4Press platform.
Data correspond to usage on the plateform after 2015. The current usage metrics is available 48-96 hours after online publication and is updated daily on week days.
Initial download of the metrics may take a while.