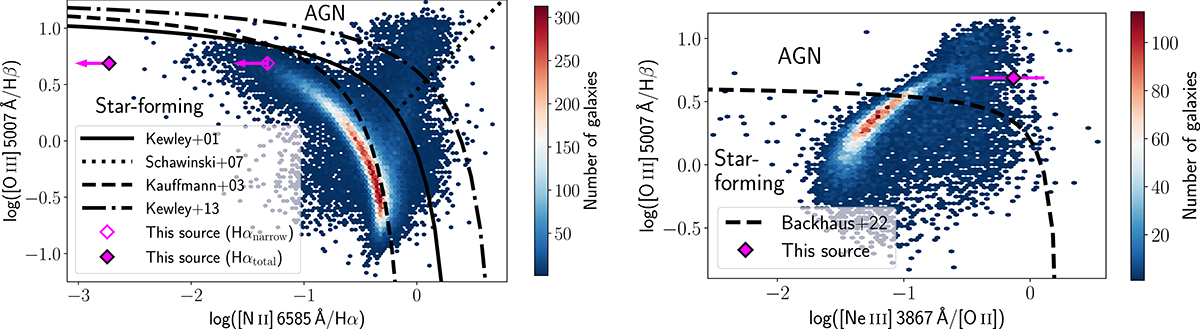
Fig. 8.
Download original image
Position of J0647_1045 on diagnostic diagrams distinguishing between emission from AGN and star formation. Left: BPT diagram of the log([N II]6585 Å/Hα) flux vs. log([O III]5007 Å/Hβ) flux of SDSS galaxies. [N II] flux is an upper limit of the 6585 Å line. The log([N II]/Hα) upper limit for this source, using only the narrow Hα component flux and the total flux (sum of the narrow and broad component fluxes), is shown by open and filled magenta diamonds, respectively. The theoretical cutoff curves for AGNs and star-forming galaxies at z = 0 from Kewley et al. (2001), Schawinski et al. (2007), and Kauffmann et al. (2003) and the redshift-dependent curve from Kewley et al. (2013) are shown as black solid, dotted, dashed, and dash-dot lines, respectively. Right: OHNO diagram of the log([Ne III]3867 Å/[O II]) vs. log([O III]5007 Å/Hβ) flux of SDSS galaxies. The curve separating AGNs and star formation from Backhaus et al. (2022) is plotted as a dashed black line. The position of this source is again marked by a magenta diamond. [O II] luminosity is the sum of the (3726, 3729 Å) doublet, modelled as a single Gaussian in our fit. In contrast, [Ne III] has been modelled as two individual Gaussians to extract the flux at ∼3867 Å separately from that at ∼3968 Å.
Current usage metrics show cumulative count of Article Views (full-text article views including HTML views, PDF and ePub downloads, according to the available data) and Abstracts Views on Vision4Press platform.
Data correspond to usage on the plateform after 2015. The current usage metrics is available 48-96 hours after online publication and is updated daily on week days.
Initial download of the metrics may take a while.