Fig. 2.
Download original image
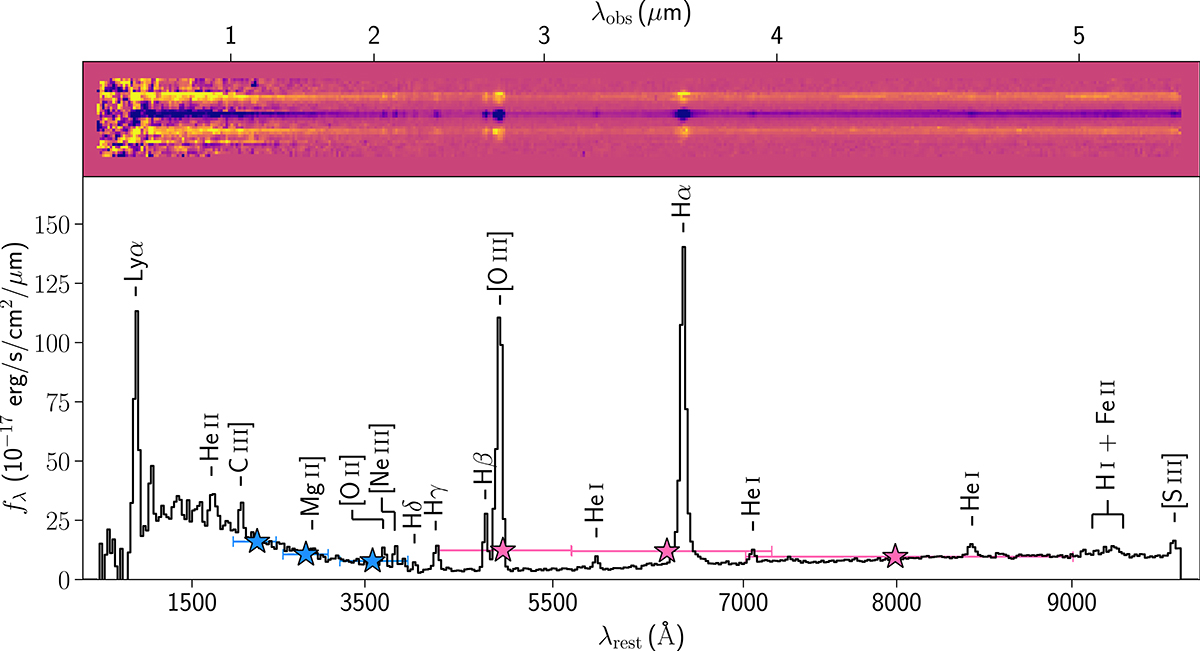
Observed NIRSpec prism spectrum of J0647_1045. Top: 2D spectrum showing the bright Hα, Hβ, and [O III] emission. Bottom: 1D spectrum (corrected for Galactic extinction) with several identified lines labelled. The observed wavelengths are shown in μm on the top axis, while the rest-frame wavelengths are plotted in Å on the bottom axis. The NIRCam photometric fluxes in a 0.5 arcsec diameter aperture in the UV filters F115W, F150W, and F200W are shown as blue stars with the NIRCam bands shown as error bars. Optical/NIR filters F277W, F356W, and F444W are similarly shown as pink stars with error bars.
Current usage metrics show cumulative count of Article Views (full-text article views including HTML views, PDF and ePub downloads, according to the available data) and Abstracts Views on Vision4Press platform.
Data correspond to usage on the plateform after 2015. The current usage metrics is available 48-96 hours after online publication and is updated daily on week days.
Initial download of the metrics may take a while.