| Issue |
A&A
Volume 691, November 2024
|
|
|---|---|---|
| Article Number | A11 | |
| Number of page(s) | 14 | |
| Section | Interstellar and circumstellar matter | |
| DOI | https://doi.org/10.1051/0004-6361/202348487 | |
| Published online | 25 October 2024 | |
OH mid-infrared emission as a diagnostic of H2O UV photodissociation
III. Application to planet-forming disks
1
Université Paris-Saclay, CNRS, Institut d’Astrophysique Spatiale,
91405
Orsay,
France
2
Leiden Observatory, Leiden University,
PO Box 9513,
2300
RA
Leiden,
The Netherlands
3
Max-Planck-Institut für Extraterrestrische Physik,
Giessenbachstrasse 1,
85748
Garching,
Germany
4
Department of Space, Earth and Environment, Chalmers University of Technology, Onsala Space Observatory,
43992
Onsala,
Sweden
★ Corresponding author; benoit.tabone@cnrs.fr
Received:
3
November
2023
Accepted:
17
June
2024
Context. The Mid-InfraRed Instrument (MIRI) on board the James Webb Space Telescope (JWST) gives unique access to the physical and chemical structure of inner disks (<10 au), where the majority of the planets are forming. However, the interpretation of mid-infrared (mid-IR) spectra requires detailed thermo-chemical models able to provide synthetic spectra readily comparable to spectroscopic observations. This is particularly important for OH, which can be excited by a number of processes.
Aims. Our goal is to explore the potential of mid-IR emission of OH to probe H2O photodissociation, and thus implicitly the far-ultraviolet (FUV) radiation field in the inner disks.
Methods. We include in the DALI disk model prompt emission of OH following photodissociation of H2O in its B~ electronic state by photons at λ < 144 nm. Compared with previous modeling work, we also take into account the propensity of forming OH in the A′ symmetric states. This model allows us to compute in a self-consistent manner the thermal and chemical structure of the disk and the resulting mid-IR line intensities of OH and H2O.
Results. The OH line intensities in the 9–13 μm range are proportional to the total amount of water photodissociated in the disk. As such, these OH lines are a sensitive tracer of the amount of H2O exposed to the FUV field, which depends on the temperature, density, and strength of the FUV field reaching the upper molecular layers. In particular, we show that the OH line fluxes primarily scale with the FUV field emitted by the central star in contrast with H2O lines in the 10–20 μm range which scale with the bolometric luminosity. OH is therefore an important diagnostic to probe the effect of Lyα and constrain the dust FUV opacity in upper molecular layers. A strong asymmetry between the A′ and A″ components of each rotational quadruplet is predicted.
Conclusions. OH mid-IR emission is a powerful tool to probe H2O photodissociation and infer the physical conditions in disk atmospheres. As such, the inclusion of OH mid-IR lines in the analysis of JWST-MIRI spectra will be crucial for robustly inferring the chemical composition of planet-forming disks. The interpretation of less excited OH lines in the MIRI-MRS range requires additional quantum calculations of the formation pumping of OH (ro-)vibrational levels by O+H2 and the collisional rate coefficients.
Key words: astrochemistry / line: formation / planets and satellites: formation / protoplanetary disks / ISM: molecules
© The Authors 2024
 Open Access article, published by EDP Sciences, under the terms of the Creative Commons Attribution License (https://creativecommons.org/licenses/by/4.0), which permits unrestricted use, distribution, and reproduction in any medium, provided the original work is properly cited.
This article is published in open access under the Subscribe to Open model. Subscribe to A&A to support open access publication.
1 Introduction
Planets form, migrate, and acquire their elemental composition in disks orbiting nascent stars. In the next decade, our knowledge of planetary systems is expected to grow considerably, with a more complete view of the frequency and distribution of planets (PLATO), but also with the determination of the elemental abundances in their atmosphere (JWST, ARIEL). One of the challenges is then to determine how the various formation pathways lead to the diversity and habitability of exoplanets.
In this context, the atmospheric elemental composition of gas giants is expected to carry information about their formation (Madhusudhan 2019). In gas-rich disks, variation in the elemental composition in the gas and in solids (ice and dust grains) is a natural outcome of the different sublimation temperatures of the main carriers of elements. This led to the idea proposed by Öberg et al. (2011) that the final elemental composition of planets is set by the location where they formed (see also Cridland et al. 2019a,b, 2020). Since then, many other complex processes that can modify the elemental composition in disks have been identified (Krijt et al. 2023), such as trapping of molecules in the cold mid-plane (known as the cold finger effect, Meijerink et al. 2009), drifting icy pebbles (Krijt et al. 2016), or destruction of carbon dust (Gail & Trieloff 2017).
Of all the species, water is a unique molecule for planet formation. Together with CO, it is the main oxygen carrier and as a result, the location of the water snowline sets the region where oxygen-rich planetesimals form and where the gas is depleted in oxygen. Water ice can also enhance the sticking of grains, allowing planetesimals to grow quickly at the ice line and initiate the formation of the cores of giant planets or super-Earths (Chokshi et al. 1993; Schoonenberg & Ormel 2017). Gas-phase water also plays a crucial role in the irradiated upper layers where most of the IR emission to be observed by JWST originates. Its emission is prominent in the infrared spectra of T Tauri disks (Carr & Najita 2008; Salyk et al. 2008), even in depleted inner disks such as DoAr 44 (Salyk et al. 2015) or PDS 70 (Perotti et al. 2023). Its numerous radiative transitions contribute to the thermal balance and water photodissociation can efficiently heat the gas (Glassgold & Najita 2015). Gas-phase water in the irradiated layers can also shield the disk by absorbing dissociating UV photons (Bethell & Bergin 2009; Ádámkovics et al. 2014; Bosman et al. 2022a). This process can greatly alter the abundances of other key species such as CO2 (Bosman et al. 2022b) or hydrocarbons (Duval et al. 2022). These latter works demonstrate that variation in the abundances of C- or O-bearing species cannot simply be associated with variation in the C/O ratio but can also be due to the ability of an H2O-rich irradiated layer to shield the disk. Therefore the study of H2O and its photodissociation in the irradiated layers is of fundamental interest to understanding the physical and chemical structure of disks.
Considering the complexity of processes that alter the distribution of chemical elements in disks, robust observational constraints are needed. ALMA has brought unique insights into disk chemistry (Dutrey et al. 2014; Öberg & Bergin 2021). However, the majority of gaseous planets that are about to be routinely characterized by JWST or ARIEL are thought to form in inner disks (≲10 au, Morbidelli & Raymond 2016; Kennedy & Kenyon 2008; Dawson & Johnson 2018), best traced by near-and mid-infrared (IR) molecular lines. These regions were made accessible thanks to the Spitzer space telescope supplemented by ground-based observations (VLT/CRIRES, TEXES, Michelle; Pontoppidan et al. 2014). A rich organic chemistry has indeed been revealed with the detections of the main carbon and oxygen carriers, namely H2O, CO, CO2, and HCN (Pontoppidan et al. 2010). Slab models and spectrally resolved ground-based observations further showed that IR emission in the 5–36 μm range originates from warm gas (500–1000 K) within a few au (Salyk et al. 2011; Carr & Najita 2011). The observed spectra of T Tauri stars also show significant diversity (Pascucci et al. 2009, 2013) that could be driven by a variation in the C/O ratio (Najita et al. 2013; Banzatti et al. 2020) or inner cavities (Banzatti et al. 2017). Therefore, the mid-IR constitutes a unique domain as it probes the gas in the planet-forming regions of disks, where gasphase H2O plays a crucial role. Today, the James Webb Space Telescope (JWST), with its unique sensitivity and good spectral resolution, is revolutionizing the field (van Dishoeck et al. 2023) by detecting weaker lines and isotopologues from previously detected species (Grant et al. 2023) and new molecular species (Tabone et al. 2023; Berné et al. 2023).
However, the interpretation of mid-IR molecular emission requires detailed modeling. Thermochemical models show that the IR emission comes from different layers, depending on the ability of each species to survive strong UV fields and on physical conditions required to excite the lines (see, e.g., Woitke et al. 2018). Therefore, the ratios of column densities obtained from slab models are difficult to interpret and detailed thermochemical models are ultimately needed to retrieve the physical and chemical structure of disks from the rich IR spectra.
To date, there has been a significant effort to model H2O chemistry and its IR emission in disks. The pioneering work of Meijerink et al. (2009) showed that water line fluxes observed by Spitzer-IRS hint at a significant depletion of small grains in disk atmospheres. The main limitation of all these models is that they are based on H2O lines that are excited by collisions and IR radiative pumping (Blevins et al. 2016). As such, their intensity depends on a complex combination of the density, temperature, and local IR radiation fields across the disk. Analysis relying on only water lines therefore remains degenerate (Antonellini et al. 2015).
In contrast, rotationally excited lines of OH lying in the mid-IR are expected to provide complementary constraints on water in IR active layers. Water photodissociation in its ![$\[\tilde{B}\]$](/articles/aa/full_html/2024/11/aa48487-23/aa48487-23-eq2.png) electronic state by photons in the 114–144 nm range produces OH in highly rotationally excited states (up to N ≃ 45, corresponding to Eup ≃ 45 000 K). The subsequent radiative deexcitation of OH products leads to a series of rotationally excited lines long-ward of 9 μm, a process called prompt emission. OH lines from highly excited rotational levels were first detected at the apex of a fast protostellar jet (Tappe et al. 2008) and later in disks (Najita et al. 2010; Carr & Najita 2014). Thanks to previous quantum calculations and experiments (Harich et al. 2000; van Harrevelt & van Hemert 2000), these authors already identified this emission as prompt emission due to H2O photodissociation. Carr & Najita (2011) showed a correlation between the accretion rate and the flux of rotationally excited lines, further highlighting the role of the UV field in the excitation of these lines. In disks, less excited rotational lines longward of 16–20 μm are often attributed to thermal excitation or chemical formation pumping by H2+O (Carr & Najita 2014). The signature of H2O photodissociation in its
electronic state by photons in the 114–144 nm range produces OH in highly rotationally excited states (up to N ≃ 45, corresponding to Eup ≃ 45 000 K). The subsequent radiative deexcitation of OH products leads to a series of rotationally excited lines long-ward of 9 μm, a process called prompt emission. OH lines from highly excited rotational levels were first detected at the apex of a fast protostellar jet (Tappe et al. 2008) and later in disks (Najita et al. 2010; Carr & Najita 2014). Thanks to previous quantum calculations and experiments (Harich et al. 2000; van Harrevelt & van Hemert 2000), these authors already identified this emission as prompt emission due to H2O photodissociation. Carr & Najita (2011) showed a correlation between the accretion rate and the flux of rotationally excited lines, further highlighting the role of the UV field in the excitation of these lines. In disks, less excited rotational lines longward of 16–20 μm are often attributed to thermal excitation or chemical formation pumping by H2+O (Carr & Najita 2014). The signature of H2O photodissociation in its ![$\[\tilde{B}\]$](/articles/aa/full_html/2024/11/aa48487-23/aa48487-23-eq3.png) state is also likely seen in the FUV where a bump at 160 nm is attributed to dissociating H2 following its production by water photodissociation (France et al. 2017). Finally, water photodissociation in the à state produces rotationally cold but vibrationally hot OH (van Harrevelt & van Hemert 2001), which produces rovibrational emission around 3 μm. Formation pumping by H2+O or collisions are however likely to dominate the excitation of the ro-vibrational levels of OH in disks, as recently found in the wind of an externally irradiated disk (Zannese et al. 2024).
state is also likely seen in the FUV where a bump at 160 nm is attributed to dissociating H2 following its production by water photodissociation (France et al. 2017). Finally, water photodissociation in the à state produces rotationally cold but vibrationally hot OH (van Harrevelt & van Hemert 2001), which produces rovibrational emission around 3 μm. Formation pumping by H2+O or collisions are however likely to dominate the excitation of the ro-vibrational levels of OH in disks, as recently found in the wind of an externally irradiated disk (Zannese et al. 2024).
In the first paper in this series we demonstrate that the fluxes of rotationally excited lines of OH are directly proportional to the amount of water photodissociated per unit time in the 114–144 nm range (Tabone et al. 2021, hereafter T21). In a slab approach (single-zone) and without relying on chemical models, the local UV flux can be inferred from H2O and OH mid-IR lines. However, this approach is limited to simple geometries and uniform physical conditions (at least within the beam of the telescope), which is rarely the case in irradiated environments such as interstellar PDRs or disk upper layers. On the other hand, when relying on a self-consistent thermo-chemical model, the OH line flux can be turned into a sensitive diagnostic. This is demonstrated in the second paper of this series, which shows that in interstellar PDRs the OH line flux is highly sensitive to the thermal pressure of the gas (Zannese et al. 2023).
In this paper we expand our modeling effort to inner disks to explore the potential of OH mid-IR lines to trace H2O photodissociation and to alleviate degeneracies in the analysis of molecular lines. In particular, the excitation of OH following H2O photodissociation via the ![$\[\tilde{B}\]$](/articles/aa/full_html/2024/11/aa48487-23/aa48487-23-eq4.png) electronic state is included in the DALI physico-chemical disk model. This allows us to connect the mid-IR emission of OH to the physical and chemical structure of the disks’ upper layers.
electronic state is included in the DALI physico-chemical disk model. This allows us to connect the mid-IR emission of OH to the physical and chemical structure of the disks’ upper layers.
This paper is organized as follows. In Sec. 2 we present the basics of DALI, the implementation of OH prompt emission, and the free parameters of the model. The processes that control OH emission are detailed using our fiducial disk model and the result of a grid of models are described in Sec. 3. MIRI-MRS predictions are finally presented based on previous Spitzer-IRS observations of T Tauri disks in Sec. 4. Our findings are summarized in Sec. 5.
2 Model
2.1 Thermo-chemical disk model
In this work the intensities of OH and H2O lines are computed in a self-consistent approach using an upgraded version of the 2D thermo-chemical code DALI (Bruderer et al. 2012; Bosman et al. 2022a). This code has been extensively used to analyze multi-wavelength observations of disks, from the millimeter to infrared domain (e.g., Bruderer 2013; Cazzoletti et al. 2018; Trapman et al. 2019; Bosman et al. 2019; Leemker et al. 2021), and is particularly well suited to model inner disk atmospheres (Bruderer et al. 2015; Bosman et al. 2018, 2019, 2022b). Given an input gas and dust density structure, the temperature of the dust and the local radiation field are computed via a 2D Monte Carlo method. The thermo-chemical state of the gas is then obtained following an iterative two-step procedure in each grid cell: first, the chemical abundances are computed assuming steady-state, and then the gas temperature is computed from the balance between heating and cooling (Bruderer et al. 2012). The second step includes radiative cooling via atomic and molecular lines, which involves solving the statistical equilibrium equations for a number of key species (Bruderer 2013). The emerging line intensities are computed using a fast ray-tracer method (Bosman et al. 2017) assuming a distance of 140 pc and an inclination of 20°.
The main chemical reactions for oxygen chemistry in the warm molecular layers involve the formation of H2O via the warm route
![$\[\mathrm{O} \underset{\mathrm{UV}}{\stackrel{\mathrm{H}_2}{\rightleftharpoons}} \mathrm{OH} \underset{\mathrm{UV}}{\stackrel{\mathrm{H}_2}{\rightleftharpoons}} \mathrm{H}_2 \mathrm{O}.\]$](/articles/aa/full_html/2024/11/aa48487-23/aa48487-23-eq5.png) (1)
(1)
The sequence of reaction requires the presence of H2. The latter species can form via (i) formation on dust grains, for which the rates stem from Cazaux & Tielens (2004), (ii) the three-body formation route, (iii) formation via CH+ +H and H−+H following radiative associations (see, e.g., Tabone et al. 2020), and (iv) formation via the hydrogenation of Polycyclic Aromatic Hydrocarbons (PAH). All these routes are included, following the implementation of Bosman et al. (2022a) for the first two, and Bruderer et al. (2012) for the second two.
In order to improve the treatment of oxygen chemistry in the warm upper layers of inner disks, we adopt the DALI version from Bosman et al. (2022a) that includes chemical heating following H2O, OH, CO, H2, and C photodestruction (Glassgold & Najita 2015), and the wavelength-dependent UV shielding of the gas by H2O. Since our models are designed to describe the warm and dense atmospheres of inner disks, the cooling via ro-vibrational lines of CO (υ ≤ 4) and H2O is included using the collisional rate coefficients from Yang et al. (2010), Walker et al. (2015), Song et al. (2015), and Faure & Josselin (2008), respectively. Cooling by OH lines is also included as described in the following section.
2.2 OH model
The excitation of OH is solved in concert with the excitation of the other species. In order to include prompt emission, we assume that only H2O photodissociation leads to the production of OH in super-thermal state distribution and that the destruction rate of an OH molecule does not depend on its quantum state. This leads to the detailed balance equation
![$\[\frac{d n_i}{d t}=\sum_{j \neq i} P_{j i} n_j-n_i \sum_{j \neq i} P_{~i j}+F_{~p d}\left(\bar{f}_i-\frac{n_i}{n(\mathrm{OH})}\right)=0,\]$](/articles/aa/full_html/2024/11/aa48487-23/aa48487-23-eq6.png) (2)
(2)
where ni [cm−3] is the local population densities of OH, Fpd is the production rate of OH via H2O photodissociation [cm−3s−1], and ![$\[\bar{f}_i\]$](/articles/aa/full_html/2024/11/aa48487-23/aa48487-23-eq7.png) is the probability to form OH in the state i following H2O photodissociation by the local UV radiation field. The coefficients Pij are the radiative and collisional transition probabilities i → j given by
is the probability to form OH in the state i following H2O photodissociation by the local UV radiation field. The coefficients Pij are the radiative and collisional transition probabilities i → j given by
![$\[P_{i j}=\left\{\begin{array}{ll}A_{i j}+B_{i j} \bar{J}_{\nu_{i j}}+C_{i j} & \left(E_i>E_j\right) \\B_{i j} \bar{J}_{\nu_{i j}}+C_{i j} & \left(E_i<E_j\right)\end{array}.\right.\]$](/articles/aa/full_html/2024/11/aa48487-23/aa48487-23-eq8.png) (3)
(3)
Here Aij and Bij are the Einstein coefficients of spontaneous and induced emission, Cij are the collisional rate coefficients, and ![$\[\bar{J}_{v_{i j}}\]$](/articles/aa/full_html/2024/11/aa48487-23/aa48487-23-eq9.png) is the mean specific intensity at the frequency of the radiative transition i → j averaged over the line profile. Following Bruderer (2013), the contribution of the lines to the local radiation field is computed in a 1+1D approach only accounting for the vertical and radial direction to obtain the escape probabilities.
is the mean specific intensity at the frequency of the radiative transition i → j averaged over the line profile. Following Bruderer (2013), the contribution of the lines to the local radiation field is computed in a 1+1D approach only accounting for the vertical and radial direction to obtain the escape probabilities.
The list of OH levels and radiative transitions stem from T21 who used data from Yousefi et al. (2018) and Brooke et al. (2016). In order to reduce the computational time, the number of OH levels has been reduced to a total of 412 by limiting the vibrational quantum number to υ ≤ 1 and including only the ![$\[\mathrm{OH}(\tilde{X})\]$](/articles/aa/full_html/2024/11/aa48487-23/aa48487-23-eq10.png) electronic ground state. All the rotational levels that are stable within a vibrational state are retained, which corresponds to N ≤ 54 and N ≤ 50 for υ = 0 and 1, respectively. Each rotational level is further split by the spin-orbit coupling labeled by Ω = 1/2, 3/2, and the Λ-doubling labeled by the e/f parity. Throughout this paper we also use the A′ and A″ symmetry (with respect to reflection about the plane of rotation of the molecule) to designate states with Ω = 1/2, f or Ω = 3/2, e and Ω = 1/2, e or Ω = 3/2, f, respectively. As in T21, we consider intra- and cross-ladder rotational transitions in the υ = 0 and υ = 1 bands and between the υ = 1 and υ = 0 states, resulting in a total of 2360 (ro-)vibrational transitions.
electronic ground state. All the rotational levels that are stable within a vibrational state are retained, which corresponds to N ≤ 54 and N ≤ 50 for υ = 0 and 1, respectively. Each rotational level is further split by the spin-orbit coupling labeled by Ω = 1/2, 3/2, and the Λ-doubling labeled by the e/f parity. Throughout this paper we also use the A′ and A″ symmetry (with respect to reflection about the plane of rotation of the molecule) to designate states with Ω = 1/2, f or Ω = 3/2, e and Ω = 1/2, e or Ω = 3/2, f, respectively. As in T21, we consider intra- and cross-ladder rotational transitions in the υ = 0 and υ = 1 bands and between the υ = 1 and υ = 0 states, resulting in a total of 2360 (ro-)vibrational transitions.
The distribution of nascent OH denoted as ![$\[\bar{f}_i\]$](/articles/aa/full_html/2024/11/aa48487-23/aa48487-23-eq11.png) in Eq. (2) stems from the compilation of T21. In this work, some of the OH ro-vibrational levels that have been discarded can be populated by prompt emission. In practice, the radiative cascade from these levels can impact the population of the rotational lines in the ground vibrational state. Therefore, a reduced distribution of nascent OH was calculated assuming that all the OH products formed in levels that were discarded to cascade toward the set of retained levels. This assumption is valid up to large densities (nH ≲ 1012 cm−3) and strong IR radiation fields. Following the recent finding of Zannese et al. (2024) and in line with recent quantum dynamical calculations (Zhou et al. 2015), we also assume that H2O photodissociation produces OH exclusively in the rotational states with an A′ symmetry Ω = 1/2, f and Ω = 3/2, e.
in Eq. (2) stems from the compilation of T21. In this work, some of the OH ro-vibrational levels that have been discarded can be populated by prompt emission. In practice, the radiative cascade from these levels can impact the population of the rotational lines in the ground vibrational state. Therefore, a reduced distribution of nascent OH was calculated assuming that all the OH products formed in levels that were discarded to cascade toward the set of retained levels. This assumption is valid up to large densities (nH ≲ 1012 cm−3) and strong IR radiation fields. Following the recent finding of Zannese et al. (2024) and in line with recent quantum dynamical calculations (Zhou et al. 2015), we also assume that H2O photodissociation produces OH exclusively in the rotational states with an A′ symmetry Ω = 1/2, f and Ω = 3/2, e.
The exact distribution of nascent OH depends on the energy of the FUV photon. However, the main difference in the distribution is between photodissociation via the H2O(Ã) state, longward of 144 nm, that produces OH in vibrationally hot but rotationally cold states (van Harrevelt & van Hemert 2001), and photodissociation via the H2O(![$\[\tilde{B}\]$](/articles/aa/full_html/2024/11/aa48487-23/aa48487-23-eq12.png) ) state, shortward of 144 nm, that produces OH in rotationally hot states (van Harrevelt & van Hemert 2003). In this work we focus on the mid-IR lines of OH that are rotation-ally excited, and therefore impacted by photodissociation via the
) state, shortward of 144 nm, that produces OH in rotationally hot states (van Harrevelt & van Hemert 2003). In this work we focus on the mid-IR lines of OH that are rotation-ally excited, and therefore impacted by photodissociation via the ![$\[\tilde{B}\]$](/articles/aa/full_html/2024/11/aa48487-23/aa48487-23-eq13.png) state and not the à state. We further neglect the wavelength dependency of the distribution of nascent OH following photodissociation through the
state and not the à state. We further neglect the wavelength dependency of the distribution of nascent OH following photodissociation through the ![$\[\tilde{B}\]$](/articles/aa/full_html/2024/11/aa48487-23/aa48487-23-eq14.png) band and adopt Lyα (λ = 121.6 nm) as a representative wavelength to compute the distribution of nascent OH. Formation pumping by the O+H2 → OH(υ, N) + H reaction is not included in order to highlight the effect of prompt emission. We also note that chemical pumping impacts relatively low-lying rotational levels of OH traced by lines longward of 16 μm.
band and adopt Lyα (λ = 121.6 nm) as a representative wavelength to compute the distribution of nascent OH. Formation pumping by the O+H2 → OH(υ, N) + H reaction is not included in order to highlight the effect of prompt emission. We also note that chemical pumping impacts relatively low-lying rotational levels of OH traced by lines longward of 16 μm.
The collisional rate coefficients for He and H2 stem from the quantum calculations of Kłos et al. (2007) and van den Heuvel et al. (in prep.). They have been further extrapolated assuming ![$\[k \propto e^{-\Delta E / k_b T}\]$](/articles/aa/full_html/2024/11/aa48487-23/aa48487-23-eq15.png) . Regarding collisions with He, the collisional rate coefficients for the A′–A″ changing transitions within an N level are poorly fitted by the latter ansatz. For these transitions, we therefore adopt the rates of the highest computed N transition of Kłos et al. (2007). In the absence of data, collisions with atomic hydrogen are not included in our model.
. Regarding collisions with He, the collisional rate coefficients for the A′–A″ changing transitions within an N level are poorly fitted by the latter ansatz. For these transitions, we therefore adopt the rates of the highest computed N transition of Kłos et al. (2007). In the absence of data, collisions with atomic hydrogen are not included in our model.
Parameters of the DALI model.
2.3 Setup and free parameters
Our goal is to explore how the mid-IR emission of OH and H2O relates to the stellar properties and to the distribution of gas and dust in the disk. Therefore, we do not model the evolution of gas and dust (e.g., hydrostatic equilibrium, dust settling, and radial drift), but we use instead a parameterized disk model. This allows us to obtain predictions that do not depend on sophisticated assumptions and theoretical preconceptions. The parameters and their values explored in this work are reported in Table 1.
The surface density profile of the gas is
![$\[\Sigma_{\text {gas }}(R)=\frac{M_D}{2 \pi R_c^2}(2-\gamma)\left(\frac{R}{R_c}\right)^{-\gamma} \exp \left[-\left(\frac{R}{R_c}\right)^{2-\gamma}\right],\]$](/articles/aa/full_html/2024/11/aa48487-23/aa48487-23-eq16.png) (4)
(4)
where the characteristic disk radius is set to Rc = 46 au, the surface density index to γ = 0.9, and the disk mass to MD = 0.03 M⊙. The vertical distribution of the gas follows an effective isothermal profile of
![$\[\rho_{\text {gas}}(R, \theta)=\frac{\Sigma_{\text {gas }}(R)}{\sqrt{2 \pi} R h(R)} ~\exp \left[-\frac{1}{2}\left(\frac{\pi / 2-\theta}{h(R)}\right)^2\right],\]$](/articles/aa/full_html/2024/11/aa48487-23/aa48487-23-eq17.png) (5)
(5)
with a disk aspect ratio of h(R) = hc(R/Rc)ψ.
Regarding the dust, we consider only the “small dust” population used by Bruderer (2013), which corresponds to a mixture of silicate and graphite with a size distribution ranging from 5 nm to 1 μm. The grains are also assumed to be fully mixed with the gas, with a homogeneous gas-to-dust mass ratio denoted as dgd, that is considered as a free parameter, with a fiducial value of dgd = 105, in line with Spitzer observations (Furlan et al. 2006). Our model does not include a population of large grains because those grains are settled in the mid-plane and have a minimal impact on the IR lines emitted from the upper layers. The PAH abundance is set to 10−6 (with respect to the ISM abundance), which gives a negligible contribution of PAH on the disk thermochemistry.
The disk is assumed to be irradiated by a T Tauri star with an effective temperature of Teff = 4250 K and a photospheric luminosity L*. The exact value of the effective temperature has little impact on the resulting thermochemical structure as long as its FUV luminosity is negligible compared to the UV excess due to accretion which is the case for accreting low-mass T Tauri stars (Teff ≲ 5000 K). The stellar X-ray spectrum corresponds to a blackbody at TX = 4.6 × 10⁷ K between 103 and 105eV with a luminosity of LX = 1030 erg s−1. The FUV continuum excess is modeled as a blackbody at 20 000 K with a total luminosity of 0.14 Lacc, corresponding to a FUV luminosity (integrated between 116–170 nm) of LFUV,cont = 0.03Lacc, in line with the FUV continuum excess measured in T Tauri disks (Schindhelm et al. 2012; France et al. 2014). We note that the ratio of the FUV luminosity to the accretion luminosity varies significantly from source to source. In this work we use the accretion luminosity as a proxy of LFUV,cont because Lacc is more systematically measured in a large sample of stars. Still, it should be kept in mind that when comparing our results to observations, the FUV luminosity should be used whenever available.
Far-UV observations show that Lyα photons contribute to about 80% of the total stellar FUV luminosity (Bergin et al. 2003; Schindhelm et al. 2012). However, the amount of Lyα reaching the IR active molecular layers depends on the scattering by H atoms followed by absorption by dust or gas. The consistent calculation of Lyα propagation is beyond the scope of the paper and in this work, we neglect scattering by H atoms as done in most thermochemical disk models (e.g., Walsh et al. 2015; Woitke et al. 2009). However, we explore the impact of Lyα photons in specific models by adding a Lyα line with a FWHM of 200 km/s and a total luminosity of 0.15 Lacc.
In short, our model is controlled by four free parameters: the stellar luminosity L*, the accretion luminosity Lacc, the contribution of Lyα photons, and the gas-to-dust mass ratio dg/d. We define a fiducial model that corresponds to a line-rich T Tauri disk with L* = 1 L⊙, Lacc = 0.12L⊙, and dg/d = 105, and no contribution of Lyα.
3 Results
3.1 Fiducial model
3.1.1 Prompt emission spectrum
Figure 1 illustrates the importance of prompt emission in the mid-infrared spectrum of our fiducial disk model. Prompt emission enhances the OH line intensities shortward of ≃25 μm with an amplifying factor that decreases with decreasing wavelength. As discussed in T21, H2O photodissociation via the ![$\[\tilde{B}\]$](/articles/aa/full_html/2024/11/aa48487-23/aa48487-23-eq18.png) state produces rotationally excited OH. The subsequent radiative cascade leads to an increase in N → N − 1 rotational lines. Compared with thermal excitation (bottom spectrum in Fig. 1), prompt emission will enhance to a greater degree the rotational lines that are emitted by high rotational levels. This is particularly the case shortward of the 20 μm range, which corresponds to quantum rotational levels of N > 14. In this specific model, thermal excitation and IR pumping start to take over prompt emission for rotational levels of N ≃ 11, corresponding to upper energies of Eup ≃ 3500 K. We note, however, that for upper energy levels up to N ≃ 23 (λ ≳ 13 μm), the formation pumping of OH via O+H2 can enhance OH lines. To date, the exact distribution of OH(υ, N) following its formation still has not been published. In the following, we therefore focus on the lines shortward of 13 μm, which are uniquely excited by water photodissociation.
state produces rotationally excited OH. The subsequent radiative cascade leads to an increase in N → N − 1 rotational lines. Compared with thermal excitation (bottom spectrum in Fig. 1), prompt emission will enhance to a greater degree the rotational lines that are emitted by high rotational levels. This is particularly the case shortward of the 20 μm range, which corresponds to quantum rotational levels of N > 14. In this specific model, thermal excitation and IR pumping start to take over prompt emission for rotational levels of N ≃ 11, corresponding to upper energies of Eup ≃ 3500 K. We note, however, that for upper energy levels up to N ≃ 23 (λ ≳ 13 μm), the formation pumping of OH via O+H2 can enhance OH lines. To date, the exact distribution of OH(υ, N) following its formation still has not been published. In the following, we therefore focus on the lines shortward of 13 μm, which are uniquely excited by water photodissociation.
Each rotational line of OH is split by the spin-orbit interaction and the Λ-doubling forming a quadruplet. Shortward of ≃12 μm, only two components of the quadruplet are spectrally resolved by MIRI-MRS, forming a doublet of opposite symmetry denoted A′ and A″ (see Sect. 2). Figure 1 (top left inset) shows that our DALI model predicts a strong asymmetry between the A′ and A″ components. This is a clear signature of water photodissociation producing OH preferentially in the A′ states. This effect was not included in previous modeling work of OH prompt emission (Tabone et al. 2021; Zannese et al. 2023). Interestingly, the A″ component is still visible in our synthetic spectrum, whereas the model assumed OH production exclusively in the A′ state. This is due to collisions at the inner edge of the disk, which populate the A″ states from the A′ states. However, we note that collisional de-excitation of the highly excited levels of OH remains uncertain since the collisional rates are extrapolated from the low N states of OH. Dedicated quantum calculations of the collisional rate coefficients are needed to interpret the exact A″/A′ ratio that can be measured by MIRI-MRS.
As shown by T21, the shape of the prompt emission spectrum of OH in the mid-IR is set by the distribution of nascent OH following H2O photodissociation shortward of 144 nm. In our DALI models, this simple property is due to the limited effect of collisions. As such, and because of our simple calculation of the distribution of OH products (see Sect. 2), the relative line intensities are always the same. Therefore, in the following, we focus only on the line at 10.07 μm that is excited enough to be always dominated by prompt emission across the disk (N = 34, Eup = 28 300 K, Ai,j = 435 s−1). This line is also less contaminated by H2O lines. The flux of other rotationally excited lines can be deduced from that of the 10.07 μm line by the simple rescaling factors provided in T21 (see their Appendix D).
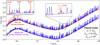 |
Fig. 1 Synthetic spectrum of OH (red and purple) and H2O (blue) for the fiducial model, at typical MIRI-MRS spectral resolution (R = 2500) with (top) and without (bottom, shifted by 0.2 Jy) OH prompt emission. OH is primarily excited by H2O photodissociation producing highly excited lines down to 9 μm. The OH lines are seen on top of the continuum and embedded in the strong H2O line forest. The OH prompt emission produces OH in the A′ symmetric states resulting in an imbalance in the four components of each rotational transition. Longward of ≃13.5 μm, we expect OH chemical pumping by O+H2 to impact the OH lines, a process that is not included in this version of our model. |
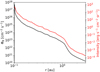 |
Fig. 2 Radial profile of the emission of the 10.07 μm OH line and of the H2O column density photodissociated per unit time in the 114–144 nm FUV range. Throughout the disk, the line intensity is proportional to the amount of H2O locally photodissociated via the |
![$\[\tilde{B}\]$](/articles/aa/full_html/2024/11/aa48487-23/aa48487-23-eq19.png)
3.1.2 Emitting area and origin of the OH emission
In T21, we showed that the intensities of rotationally excited OH lines are proportional to the column density of H2O photodissociated per unit time along the line of sight defined as
![$\[\Phi_B=\int n_{\mathrm{H}_2 \mathrm{O}}(z) k_B(z) \mathrm{d} z \quad\left[\mathrm{~cm}^{-2} \mathrm{~s}^{-1}\right],\]$](/articles/aa/full_html/2024/11/aa48487-23/aa48487-23-eq20.png) (6)
(6)
where kB(z) is the photodissociation rate of H2O in the ![$\[\tilde{B}\]$](/articles/aa/full_html/2024/11/aa48487-23/aa48487-23-eq21.png) band (114–144 nm) leading to OH. Figure 2 demonstrates that this simple property pertains across most of the radial extent of the disk. In particular, the specific intensity of the 10.07 μm OH line scales as
band (114–144 nm) leading to OH. Figure 2 demonstrates that this simple property pertains across most of the radial extent of the disk. In particular, the specific intensity of the 10.07 μm OH line scales as
![$\[I \simeq 10^{-4}\left(\frac{\Phi_B}{10^{10}}\right) \mathrm{erg} ~\mathrm{~s}^{-1} \mathrm{~cm}^{-2} ~\mathrm{sr}^{-1},\]$](/articles/aa/full_html/2024/11/aa48487-23/aa48487-23-eq22.png) (7)
(7)
in line with the scaling provided in T21, with the modification that OH is only produced in the A′ state. In the innermost part of the disk, the intensity differs from this scaling. This is due to the inclination of the disk and due to the OH line becoming optically thick above ΦB ≃ 1017cm−2 s−1. We note that order of magnitude estimates of the OH-H collisional rate coefficients are needed to check whether collisional deexcitation with H can quench prompt emission in the innermost region.
The implication of Eq. (7) is that rotationally excited OH lines do not directly depend on the OH abundance, but on the abundance of H2O in the exposed layers. The distribution of gas-phase water is shown in Fig. 3. We recover the two main reservoirs of gas-phase water described by many authors though with differing definitions: (a) the water-rich reservoir within the snow line (r ≃ 1 au) and close to the midplane (z/r < 0.4), corresponding to the bulk of H2O that is well shielded but difficult to observe due to dust and gas opacity effects (Notsu et al. 2019); (b) the irradiated water reservoir (G0 ≳ 104) where molecules are actively photodissociated and reformed on short timescales (≲ a few days). We also recover that the radial extent of this reservoir corresponds to the region where H2O UV-shielding operates (Bosman et al. 2022a).
Using the example of the H2O (152,13 −141,14) line at 12.519 μm (Eup = 4, 130 K, Ai,J = 1.5 s−1), Fig. 3 shows that the brightest H2O mid-IR lines are tracing this thin irradiated layer and not the bulk of the H2O in the inner disk. As described by Antonellini et al. (2015) and Bosman et al. (2022a), among others, the mid-IR spectrum of water is indeed dominated by optically thick lines that readily saturate above N(H2O) ≳ 1018 cm−2 and require high temperatures to be excited (TK ≳ 400 K). It means that the H2O emitting region is generally inside of the H2O snow surface. Since H2O snow surface moves toward the star closer to the mid-plane, the radial extent of the H2O emitting region and the mid-plane snowline, which is of interest for planet formation, are not unambiguously linked. In our fiducial model, the radial extent of the water-rich atmosphere is about that of the mid-plane snowline (see Fig. 3). We refer to Notsu et al. (2016) for an extensive study of which region is traced by different H2O lines, including the far-IR and sub-millimeter domain.
Interestingly, OH mid-IR emission originates from the same layer, though at a somewhat higher altitude where H2O abundance is lower than ≃10−4. This feature is due to the fact that the line emissivity is proportional to the product of the H2O density and the strength of the UV radiation field. At high altitudes, H2O is fully dissociated and thus underabundant, while near the mid-plane the UV radiation is reduced by extinction. In other words, the OH line traces the optimal region where H2O is abundant and exposed to the UV. In practice, the emitting area covers strongly irradiated regions ranging from G0 = 105 up to 108 where water is relatively abundant.
The OH emission is also radially confined to the inner disk, within 0.5 au. In particular, the line intensity drops steeply with the distance to the star beyond ≃ 1 au (see Fig. 2). This is directly related to the radial distribution of H2O and to the strength of the UV radiation field (see black lines in Fig. 3): farther away from the star, the gas and dust temperature is too low to activate efficient gas-phase formation of H2O (see Sect. 3.1.3) and the radiation field drops due to geometrical dilution. Interestingly, the steep drop in OH line intensity around 1 au corresponds to the location where H2O UV-shielding stops operating due to the too low column density of H2O.
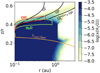 |
Fig. 3 Disk thermochemical structure of our fiducial model. The emitting area of the rotationally excited OH line at 10.07 μm and the H2O line at 12.519 μm are overplotted on the distribution of the gas-phase water abundance in the disk (color map) and the local FUV radiation field attenuated by gas and dust (black contours) for our fiducial model. |
3.1.3 Main physico-chemical processes for OH mid-IR emission
Because OH mid-IR line intensities are proportional to the amount of H2O photodestroyed in the upper layer, they are very sensitive to the physical and chemical conditions in these regions. In order to highlight the main processes and understand the dependence of OH line intensity on disk and stellar properties (see the next section), we “dissect” the upper layer of our fiducial model, where OH emission originates.
Panels a and b in Fig. 4 show the chemical and physical structure of the IR active layer. Across this molecular layer, destruction by X-ray-generated molecular ions is negligible compared to FUV photodissociation (Ádámkovics et al. 2014). Both H2O and OH form via the neutral-neutral formation pathway shown in Eq. (1) (Glassgold et al. 2009), which is initiated by the formation of H2. As seen in Fig. 4a, it is indeed at the H/H2 transition that H2O starts to be abundant. Therefore, the density and the radiation field at the H/H2 transition are of prime importance for the intensity of OH mid-IR lines.
The H/H2 transition is set by the balance between the formation and destruction of H2. In the warm IR active layer, H2 formation is primarily due to surface chemistry even though three-body reactions tend to take over close to the star and for high gas-to-dust mass ratio (r ≲ 0.2 au, dgd ≳ 104). Interestingly, we find that H2 is self-shielded in the atomic layer (z/r ≲ 0.52) and primarily destroyed via the two-step process:
![$\[\mathrm{H}_2+\mathrm{O} \rightleftharpoons \mathrm{OH}+\mathrm{H} \xrightarrow{\mathrm{UV}} \mathrm{O}+2 \mathrm{H}.\]$](/articles/aa/full_html/2024/11/aa48487-23/aa48487-23-eq23.png) (8)
(8)
Therefore, the presence of OH at the H/H2 transition is the signpost of H2 indirect photodestruction (see Fig. 4a). This constitutes an important difference with more diffuse PDRs at the edge of molecular clouds for which H2 self-shielding, supplemented by dust attenuation, controls the H/H2 transition (e.g., van Dishoeck & Black 1986). In that regard, the progressive increase in H2 with decreasing altitude is driven by the decrease in far-UV flux due to dust attenuation (see Figs. 4a and b). As we already noted, for the same gas distribution the position of the H/H2 transition will therefore depend on the abundance of small grains, which controls the attenuation of the UV field and the formation rate of H2. The full conversion of H into H2 at z/r ≃ 0.44 is also driven by H2O UV shielding that reduces dramatically OH photodissociation and therefore the indirect destruction of H2 (see Figure 4b, black vs gray lines).
Abundant H2O in the irradiated layer also requires a relatively high temperature because H2 + O → OH + H and H2 + OH → H2O + H have high activation energies. Figure 4c shows that the gas is thermally coupled to the dust at the H/H2 transition with a temperature of about 600 K, enough to lead to abundant H2O despite the strong UV field (x(H2O) ≃ 10−5). The temperature-dependent formation of H2O also controls the radial extent of the irradiated H2O reservoir (Fig. 3). As mentioned by Ádámkovics et al. (2014) and further discussed in Bosman et al. (2022a), the heating of the gas is dominated by OH and H2O photodissociation with negligible contribution from X-ray heating. We further note that the inclusion of ro-vibrational cooling by CO and H2O lines is particularly important in this layer as it brings the gas temperature close to that of the dust. Aditionally, vertical mixing, which is not included in the present model, can inject H2 and H2O to more exposed layers, possibly enhancing the OH mid-IR emission (Woitke et al. 2022).
In summary, the amount of H2O exposed to the strong UV field is deeply entangled with the physical conditions in the IR active layers via complex feedbacks: the H2 abundance that sets the location of the IR active layer depends on its destruction by O followed by OH photodissociation. Following the increase in H2 abundance, the H2O abundance rises, forming the irradiated reservoir required for the mid-IR emission of OH. This means that OH mid-IR lines, in concert with H2O lines, are promising diagnostics to test thermochemical disk models and constrain dust properties in the IR active layers.
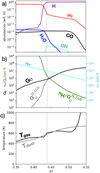 |
Fig. 4 Physical and chemical structure of the irradiated layer at r = 0.3 au for our fiducial disk model. |
![$\[G_0^{H_2 O s h}\]$](/articles/aa/full_html/2024/11/aa48487-23/aa48487-23-eq24.png)
3.2 Grid of models
Figure 5 illustrates how H2O and OH lines vary when changing key parameters, namely the luminosity of the star L*, the accretion luminosity Lacc, the inclusion of Lyα photons, and the gas-to-dust mass ratio dgd. OH emission appears to be sensitive to all of these parameters but L*, whereas H2O emission primarily depends on L* and on the gas-to-dust mass ratio dgd. These essential features are further explored on a large grid of models in Figure 6 where we present the flux of the OH and H2O blends at 10.06 μm and 12.6 μm, respectively. These blends correspond to the N = 34 → 33 OH quadruplet and five H2O lines dominated by upper energy levels of ≃4 000 K. We note that for OH lines at longer wavelengths (≳13.5 μm) these trends might be different as OH lines can be excited by chemical pumping. The synthetic spectra convolved at the MIRI-MRS spectral resolution are available from the community on a Zenodo repository1.
3.2.1 Stellar luminosity
For fiducial disk parameters, we find that increasing the stellar luminosity L* does not impact the OH line flux but enhances the H2O line flux (Figs. 5b and 6b). The fact that the OH line flux is independent of L* could be surprising since higher luminosity results in a globally warmer disk, and therefore more efficient H2O formation. In fact, OH emission is dominated by the inner disk, typically within 0.8 au. Changing the stellar luminosity has only a limited impact on the amount of H2O in that specific region, and therefore on the local line intensity (see radial intensity profiles in Fig. A.1). Even so, increasing the bolometric luminosity increases the radial extent of the H2O rich exposed layer. This produces more extended OH emission, but this contributes significantly to the total line flux only for L* ≳ 4.5 L⊙.
In contrast, the 12.5 μm H2O blend is thermally excited and optically thick across its emitting region. Increasing the bolometric luminosity has therefore two impacts illustrated in the Appendix (see Fig. A.1). First, in the inner disk (≲1 au), the temperature of the emitting layer is higher, and therefore the local intensity is higher (Iv = Bv(TK)). Second, the region where dust and therefore gas is warm enough to sustain efficient H2O formation in the irradiated layer extends to a larger distance. Therefore, the H2O line flux increases with L* because the local intensity is higher and the emitting size increases. Quantitatively, for our fiducial disk parameters, the H2O line flux is found to scale as ![$\[L_{bol}^{0.5}\]$](/articles/aa/full_html/2024/11/aa48487-23/aa48487-23-eq25.png) , where Lbol = L* + Lacc is the bolometric luminosity of the star.
, where Lbol = L* + Lacc is the bolometric luminosity of the star.
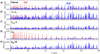 |
Fig. 5 Synthetic spectrum of H2O and OH emission depending on the luminosity of the star, the accretion luminosity, the contribution of Lyα photons, and the gas-to-dust mass ratio. We recall that the fiducial model is a disk with a gas-to-dust mass ratio of dgd = 105 orbiting a T Tauri star with a stellar luminosity of L* = 1 L⊙, an accretion luminosity of Lacc = 0.12 L⊙, and no contribution of Lyα to the impinging FUV field. The scales in panels d) and e) are different, highlighting the strong impact of the putative Lyα photons and the gas-to-dust ratio. |
3.2.2 Accretion luminosity
Because OH is produced by H2O photodissociation, the increase in line flux with increasing accretion luminosity is expected as the incident FUV flux is increased accordingly. However, this simple interpretation hides a subtler balance in the physico-chemical processes. The OH emissivity is indeed proportional to the product ![$\[G_0 n_{\mathrm{H}_2 \mathrm{O}}\]$](/articles/aa/full_html/2024/11/aa48487-23/aa48487-23-eq26.png) . Stronger FUV fields could then translate to less H2O, canceling the expected increase in OH fluxes. As the incident FUV flux increases, the H/H2 transition moves deeper into the disk where nH/G0 ≃ 106−107 cm−3, such that the gas density is higher. This allows H2O to still form efficiently at the H/H2 transition despite the increase in the incident UV field. The net balance is positive and the OH line flux increases with Lacc. For our fiducial model, we find that the OH flux scales as
. Stronger FUV fields could then translate to less H2O, canceling the expected increase in OH fluxes. As the incident FUV flux increases, the H/H2 transition moves deeper into the disk where nH/G0 ≃ 106−107 cm−3, such that the gas density is higher. This allows H2O to still form efficiently at the H/H2 transition despite the increase in the incident UV field. The net balance is positive and the OH line flux increases with Lacc. For our fiducial model, we find that the OH flux scales as ![$\[\propto L_{a c c}^{0.5}\]$](/articles/aa/full_html/2024/11/aa48487-23/aa48487-23-eq27.png) . Because the gas and dust temperature is relatively constant in the vertical direction, this small change in emitting height does not impact the emission of the optically thick H2O lines.
. Because the gas and dust temperature is relatively constant in the vertical direction, this small change in emitting height does not impact the emission of the optically thick H2O lines.
3.2.3 Lyα
The OH line flux also depends strongly on the contribution of photons shortward of 144 nm to the accretion luminosity. When Lyα is added to the UV continuum excess, the OH line fluxes are increased by about a factor of 4 over a wide range of Lacc and L* (see dashed and solid purple lines in Figs. 6a and b). In contrast, the H2O line fluxes are not affected by Lyα photons.
The effect of including Lyα photons for a fixed value of Lacc is to increase the amount of dissociating photons (λ ≲ 200 nm). Therefore, including Lyα photons for a fixed value of Lacc has an effect similar to increasing Lacc. The analysis conducted above for the impact of Lacc can be repeated: including Lyα photons results in a larger amount of H2O photodissociated, whereas H2O formation is enhanced by the H/H2 transition being deeper (higher densities). H2O line fluxes are not affected because they depend primarily on the bolometric luminosity and less on the exact spectral distribution of the stellar spectrum.
3.2.4 Gas-to-dust mass ratio
Figure 6c shows that OH line flux is approximately proportional to the gas-to-dust ratio, whereas the increase in H2O line flux is shallower ![$\[\left(\propto d_{g d}^{0.5}\right)\]$](/articles/aa/full_html/2024/11/aa48487-23/aa48487-23-eq28.png) . Therefore, the gas-to-dust ratio is the only parameter that impacts the H2O and the OH lines. This is a result of a complex combination of thermal and chemical effects.
. Therefore, the gas-to-dust ratio is the only parameter that impacts the H2O and the OH lines. This is a result of a complex combination of thermal and chemical effects.
Depleting dust grains has three direct effects: (1) an increase in the penetration depth of the UV photons, (2) a reduction in H2 formation rate on dust, and (3) an increase in dust temperature. The first two effects lead to a shift of the H/H2 transition deeper into the disk where densities are larger keeping a high density of H2O at high UV flux. Similar to an increase in Lacc, this leads to an increase in the amount of photodissociated H2O, and therefore of the OH lines. The increase in H2O lines is mostly driven by the increase in dust, and therefore gas temperature. Similar to the effect of increasing L*, the local line intensity of optically thick H2O lines is larger and the emission increases at a larger distance. This results in an increase in H2O line flux with the dgd ratio.
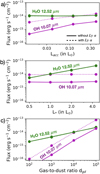 |
Fig. 6 Effect of the stellar and disk parameters on the OH and H2O emission. OH is primarily sensitive to the stellar FUV flux, which depends on Lacc, on the inclusion of Lyα photons, and on the gas-to-dust ratio. The H2O line flux is sensitive to the bolometric luminosity of the star and the gas-to-dust ratio. In this figure the reference value of the parameters that are kept constant are dgd = 104, L* = 1 L⊙, and Lacc = 0.12 L⊙. The line fluxes are calculated by integrating the H2O emission from 12.5 to 12.537 μm and the OH emission from 10.05 to 10.08 μm. |
4 Discussion
Our grid of DALI models shows that OH emission depends strongly on the disk parameters and is therefore a promising diagnostic to analyze the physical and chemical structure of IR active layers. Furthermore, H2O and OH line fluxes exhibit distinct variation with basic disk parameters that allows the effects of different parameters to be disentangled. In this section we discuss our results and provide a first comparison with Spitzer-IRS observations in preparation for an in-depth analysis of JWST-MIRI spectra where OH quadruplets are now seen in multiple disks, though at relatively long wavelengths (λ > 14 μm, Grant et al. 2023; Kóspál et al. 2023; Gasman et al. 2023b).
4.1 Measuring the local ultraviolet field
We found that rotationally excited OH lines are optically thin over a large fraction of its emitting area and we recovered the results of T21, whose fluxes are directly proportional to the amount of H2O photodestroyed by photons in the 114–144 nm range. In T21 we proposed inferring the local FUV flux by estimating the photodissociation rate of H2O [s−1] as
![$\[k_B=\Phi_B / N\left(\mathrm{H}_2 \mathrm{O}\right).\]$](/articles/aa/full_html/2024/11/aa48487-23/aa48487-23-eq29.png) (9)
(9)
This method would be particularly promising for disks since it would give access to the FUV flux at the H/H2 transition, a parameter that is crucial for all the disk chemical models and yet unconstrained. In this section, we discuss the limitations of Eq. (9) in the context of planet-forming disks and postpone the design of a model-independent approach to observationally infer the FUV flux in the disks’ upper layers to a future paper.
We can already see that OH emission is radially extended and covers more than two orders of magnitude in G0 (see Fig. 3). This means that the value of G0 estimated from Eq. (9) is expected to be representative of a radius where the bulk of the OH emission originates from. In a model-independent approach, measuring the radial extent of OH emission from spatially resolved observations appears unfeasible with JWST and even with the ELT-METIS. One of the most promising methods is then to obtain spectrally resolved spectra of OH mid-IR lines, for example using the TEXES spectrograph (Salyk et al. 2019).
The use of Eq. (9) also requires determining the column density of H2O in the emitting region of OH only. In order to determine the H2O column density, the mid-IR lines of H2O could appear promising as they trace a similar radial extent. However, the OH emission is also confined to a very thin layer above the bulk of the H2O reservoir. Therefore, the main challenge is to estimate the H2O column density exposed to the FUV field. One could argue that the brightest H2O lines are tracing an altitude close to that of OH (see the example of the H2O line at 12.5 μm in Fig. 3). However, these lines are also optically thick, which limits our ability to directly infer the column density in the irradiated layer.
A lower limit on the intensity of the FUV radiation field in the emitting layer of OH can still be placed. The attenuation of the radiation field is indeed due to a combination of dust attenuation and H2O UV shielding. When H2O shielding starts to operate, the FUV field drops steeply with altitude (see Fig. 4b). Therefore, OH mid-IR emission comes necessarily from a layer with N(H2O) ≲ 1018 cm−2. Injecting this upper limit into Eq. (9) provides a lower limit on kB, and therefore on the UV flux in the 114–144 nm range.
4.2 Detectability with MIRI-MRS
Several MIRI-MRS spectra show OH lines in the 15 μm region (Grant et al. 2023; Kóspál et al. 2023; Gasman et al. 2023b), but no studies have yet been carried out at shorter wavelengths where OH emission can be uniquely attributed to prompt emission. In order to estimate the detectability of rotationally excited lines with MIRI-MRS, we apply our modeling results to previous Spitzer-IRS results. Rotationally excited lines of OH shortward of 13 μm have been analyzed in detail only in two disks: TW Hya, a transition disk, and DG Tau, a very strong accretor. In order to discuss the detectability of OH lines for the bulk of the population of T Tauri disks, we therefore focus on the H2O line fluxes measured with Spitzer-IRS to validate our DALI models and predict OH lines observable with JWST-MIRI-MRS.
Our sample stems from the compilation of mid-IR H2O line fluxes published by Banzatti et al. (2017). We further reduce the sample by selecting disks around T Tauri stars with an upper threshold in stellar mass of 1.4 M⊙ and a bolometric luminosity of Lbol = 5 L⊙. Since we focus on full disks, we excluded the disks with gas cavities by selecting the sources with an inner CO disk smaller than RCO = 0.2 au (Banzatti & Pontoppidan 2015). This criterion is thought to be a better tracer of the inner gaseous disk than the infrared excess n13–30 used by Brown et al. (2007), for example (see discussion in Banzatti et al. 2020, Appendix D). With these criteria, we are left with a sample of 13 T Tauri disks with stellar luminosities ranging from 0.4 to 3.4 L⊙ and accretion luminosities from 0.04 to 2 L⊙. This allows us to explore the main trends and intrinsic scatter in the observed line fluxes. Of all the lines detected by Spitzer-IRS, we select the 12.52 μm H2O blend integrated between 12.5 and 12.537 μm for which we recall that our modeling predicts a similar emitting region as rotationally excited OH (see Fig. 3). All the fluxes are rescaled to a distance of 140 pc.
Because our modeling predicts that the H2O lines depend primarily on the bolometric luminosity of the star, we plot in Fig. 7a the measured 12.5 μm H2O line flux as a function of Lbol. The observations agree well with our prediction that H2O line fluxes increase with Lbol. However, a large scatter in this correlation combined with the relatively narrow range in Lbol prevent us from deriving robust scaling. The absolute line flux is well reproduced by models with a strong depletion of small grains in the atmosphere. In particular, the relatively large scatter in the ![$\[F_{\mathrm{H}_2 \mathrm{O}}-L_{b o l}\]$](/articles/aa/full_html/2024/11/aa48487-23/aa48487-23-eq30.png) relation is in line with our predictions with gas-to-dust mass ratio of dgd = 104 −105. This result is consistent with the early models of Meijerink et al. (2009), later confirmed by Antonellini et al. (2015) and Bosman et al. (2022a). An important caveat with regard to this comparison is that our sample is biased toward sources showing bright H2O lines in the mid-IR. In fact, H2O is detected in only 50% of the T Tauri stars of G, K, and M type (Pontoppidan et al. 2010). It means that Fig. 7a represents only the tip of the distribution of H2O flux. JWST observations will be crucial to have an unbiased sample with increased detection rates of H2O.
relation is in line with our predictions with gas-to-dust mass ratio of dgd = 104 −105. This result is consistent with the early models of Meijerink et al. (2009), later confirmed by Antonellini et al. (2015) and Bosman et al. (2022a). An important caveat with regard to this comparison is that our sample is biased toward sources showing bright H2O lines in the mid-IR. In fact, H2O is detected in only 50% of the T Tauri stars of G, K, and M type (Pontoppidan et al. 2010). It means that Fig. 7a represents only the tip of the distribution of H2O flux. JWST observations will be crucial to have an unbiased sample with increased detection rates of H2O.
In contrast, our models predict that OH mid-IR lines are primarily sensitive to the FUV field reaching the warm molecular layer. Therefore, in Fig. 7b, we plot the observed OH flux as a function of the accretion luminosity Lacc with and without Lyα photons and for the gas-to-dust ratios compatible with Spitzer-IRS line fluxes. The stellar luminously is kept constant to its fiducial value (L* = 1 L⊙). Interestingly, the OH line fluxes at 12.6 μm measured by Spitzer-IRS are well matched by our DALI models with a gas-to-dust ratio of 105 (see Appendix B.1). However, the Spitzer-IRS line fluxes might be contaminated by the strong water lines in that region, and robust MIRI-MRS detection of these lines is required to refine this analysis. Here, we discuss the detectability of the OH lines with MRS-MRS. All the models predict line fluxes at 140 pc that are detectable by JWST within 20 min of integration time (Glasse et al. 2015) down to Lacc ≃ 10−2 L⊙. As expected by the scalings found in this work, disks with a high gas-to-dust ratio and high accretion luminosity are prime targets to detect OH lines in the 9–13 μm range. Interestingly, the FUV bump at 160 nm observed in T Tauri disks, when interpreted as a signature of water photodissociation via the channel O+H2, indicates a typical amount of photodissociated water of about 1041−1042 water molecules s−1 (France et al. 2014). Converting this number into an OH mid-IR line flux (OH+H channel) we obtain typical values of about 10−14−10−13 erg cm−2 s−1 (for a distance of 140 pc), in line with the range of predicted values shown in Fig. 7b. We also note that for low gas-to-dust ratios and luminous stars, the contribution of H2O lines is substantial, even in the 10 μm spectral region. A robust water line analysis (e.g., with 1D slab models predicting the entire forest of water lines), will be crucial to analyze the OH lines.
One of the major limitations in the detection of OH lines by MIRI-MRS is spectral fringing, caused by coherent reflections inside the detector arrays (Argyriou et al. 2020). In Fig. 7c, we quantify the detection limit of the OH line at 10.07 μm against residual fringe amplitude. The line-to-continuum ratio is found to depend strongly on the gas-to-dust ratio; a high gas-to-dust ratio results in a weaker continuum flux, whereas the lines are enhanced. The possible contribution of Lyα increases substantially the line-to-continuum contrast by amplifying the OH lines. Quantitatively, fringe correction methods implemented in the standard JWST pipeline reduce the fringe amplitude to only about 3–10% at 10 μm, which strongly limits the detectability of the lines. However, if the MIRI-MRS observation setup includes target acquisition, and given the fact that OH emission is expected to be compact (≲0.05″), advanced fringe correction methods taking into account the dependence of the fringe properties on the MIRI-MRS pupil illumination and detector pixel sampling is recommended (psff correction, see Gasman et al. 2023a). Alternatively, observations of asteroids as precise empirical reference sources allow us to achieve high spectral contrast (Pontoppidan et al. 2024). Typical residual fringe amplitudes are found to be about 0.5%, enough to detect OH lines over a wide range of parameters (see gray area in Fig. 7c). We also note that our estimate of the line-to-continuum ratio is a pessimistic estimate since it is estimated at 10 μm where the dust silicate feature is maximal.
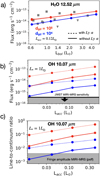 |
Fig. 7 Predictions for JWST-MIRI-MRS. (a) Comparison between Spitzer-IRS fluxes of the H2O blend at 12.5 μm and our DALI models for two values of gas-to-dust mass ratio. Spitzer-IRS fluxes, represented by gray markers (triangles for upper limits and squares for detections), are well matched by dust-depleted disk atmospheres. The accretion luminosity is set to its fiducial value of Lacc = 0.12 L⊙, recalling that Lacc has little effect on H2O line fluxes. (b) OH line fluxes at 10.07 μm as a function of Lacc. For dust depletion factors in line with Spitzer-IRS water line fluxes and without considering MIRI-MRS fringes, OH is expected to be detected. (c) The contrast between the OH line at 10.07 μm and the continuum. The gray area shows the typical residual noise after a psff fringe correction (Gasman et al. 2023a) or calibration with observations of asteroids (Pontoppidan et al. 2024). |
4.3 Far ultraviolet excess and the role of Lyα
The impact of Lyα photons onto the warm molecular layers constitutes a major uncertainty in all disk thermochemical models. The difficulty comes from the fact that Lyα photons, which represent up to 90% of the FUV excess are scattered by H atoms before being absorbed by dust or gas. Therefore, the calculation of the propagation of Lyα photons requires coupling thermochemistry upon which the H abundance depends and radiative transfer. In our model, only dust scattering and absorption are taken into account.
Bethell & Bergin (2011) first demonstrated that scattered Lyα photons can penetrate into the molecular layers, assuming that H2 is formed on dust grains and destroyed by photodissociation. However, our study of the H2 chemistry (see Sec. 3.1) shows that, in inner disks, H2 is also destroyed by atomic oxygen, resulting in an H/H2 transition being closer to the mid-plane where the Lyα effective path-length is greatly increased. Including a complete chemical model and a simplified propagation model for Lyα photons, Ádámkovics et al. (2016) supports however the relevance of Lyα photons in the water-rich warm layer, but using a low gas-to-dust ratio that is inconsistent with the observations of H2O lines. Interestingly, water photodissociation by Lyα photons is also evidenced by FUV observations (France et al. 2017). More recently, Calahan et al. (2022) used a realistic gas-to-dust ratio and an extensive chemical network and found that the Lyα photons have a negligible contribution to the FUV field in the molecular layers. All in all, the propagation of Lyα photons down to the molecular IR active layer is still debated. In this context, OH lines, in synergy with H2O lines, are promising avenues to constrain the propagation of Lyα photons down to the molecular layers.
In this work we also modeled the FUV continuum excess as a blackbody at 20 000 K. The exact shape of the FUV continuum excess remains uncertain because the observational constraints depend on the assumed dust extinction laws. In addition, a variation from source to source of the spectral slope is also found in UV observations (France et al. 2014). Contemporaneous observations of the FUV excess and of the mid-IR emission will be crucial in the JWST era. Our prediction of OH line flux as a function of the accretion luminosity should therefore be taken with caution. Whenever available, we recommend using the observational constraints of the FUV luminosity instead of Lacc, using the conversion factor assumed in our model of Lcont,FUV = 0.03 Lacc.
4.4 Other parameters
Throughout this work, we systematically explored the effect of a limited number of free parameters that are believed to be crucial. In this section we briefly discuss the effect of the other parameters. Using a fixed dust property, we demonstrated that the dust abundance in disk atmospheres regulates the IR emission of both H2O and OH. In particular, high values of the gas-to-dust ratio are inferred from Spitzer-IRS observations, in line with the previous modeling of H2O IR emission. However, this has been established using a single dust composition and a single dust size distribution. The decisive impact of dust is via the attenuation of the UV photons and the formation rate of H2, two processes that involve the available dust surface per unit volume. Therefore, regardless of the exact dust size distribution, the most important dust property is the effective cross section per H atoms: for our choice of dust distribution, σdust/H = 8 × 10⁻²²(dgd/102)−1 cm2. We also note that the dust size and composition affect dust temperature, and therefore the H2O lines. Conversely, our results show that the analysis of H2O and OH lines, in concert with the continuum emission, is crucial for the understanding of dust evolution in inner disks (Greenwood et al. 2019). Abundant PAHs in the irradiated layers can enhance the formation of H2 by PAH hydrogenation and H2O formation via the increased photoelectric heating. These two effects increase the amount of photodissociated water, and therefore the OH mid-IR line fluxes. We find that for the fiducial model, the abundance of PAH needs to have an abundance of at least 10−2 with respect to the ISM to affect the OH mid-IR lines. Synthetic predictions of PAH emission for specific UV radiation fields are required to adopt PAH abundances consistent with the non-detection of aromatic infrared bands around most T Tauri stars (Geers et al. 2006).
The disk gas mass was kept constant, whereas the gas mass of T Tauri disks inferred from sub-millimeter continuum flux typically spans more than an order of magnitude (Manara et al. 2023). However, for a fixed gas-to-dust ratio, only a small dependency of H2O and OH line fluxes on disk mass is found (less than 50% between MD = 3 × 10⁻² − 3 × 10⁻³M⊙). This result seems in tension with Antonellini et al. (2015), who found a strong dependency of mid-IR H2O lines flux on disk mass. However, in the latter study, dust settling is computed in a self-consistent way such that a high disk mass corresponds to a stronger depletion of dust in the IR active upper layers.
Throughout this work, we also assumed a full T Tauri disk with a smooth distribution of gas down to 0.1 au. Following the analysis of Banzatti et al. (2017), we could expect that any cavity in the gas would quench OH mid-IR lines. Determining the critical gap size above which OH emission would be quenched is beyond the scope of this paper. Interestingly, the disk of TW Hya, which has a gap of 2.4 au, exhibits a deficit in hot H2O and OH near-IR lines, but has detected OH and H2O lines longward of 10 μm (Najita et al. 2010; Henning et al. 2024). Moreover, the OH/H2O flux ratio at 12.5 μm is relatively high compared to the typical ratio found in full disks (OH/H2O=3 vs. ≃ 0.5; Banzatti et al. 2017). This feature is likely due to the fact that the 12.5 μm H2O blend needs high density and high temperature to be excited, whereas OH can emit as long as there is enough H2O to be photodissociated. Therefore, we can expect the OH/H2O flux ratio 12.5 μm to increase as a gap opens before the OH flux drops below the detection limit. For large gas cavities, OH emission is expected to be confined to the inner edge of the cavity where the FUV field directly illuminates the cavity wall, similar to the CO ro-vibrational emission in low NIR Group I Herbig disks (Bosman et al. 2019). Disks with large cavities remain an open topic as evidenced by the recent discovery of hot water in the disk of PDS 70, revealing active oxygen chemistry even in gas-depleted inner disks (Perotti et al. 2023). We can also speculate that the presence of a forming gas-giant planet can locally increase the gas temperature (e.g., Cleeves et al. 2015), releasing water in the gas phase. The UV radiation emitted by such an accreting planet (Aoyama et al. 2018) could then lead to a bright spot seen in OH mid-IR emission.
5 Conclusion
In this work, we explore the potential of the rotationally excited OH lines in the mid-IR for the study of planet-forming disks. To reach this goal results from quantum mechanical calculations resolving the quantum state of the OH product following H2O photodissociation are implemented in the DALI thermochemical disk model. An important addition compared to the modeling work of Tabone et al. (2021) and Zannese et al. (2023) is that OH is assumed to be formed in the A′ symmetric state, in line with recent quantum calculation studies (Zhou et al. 2015). An extensive grid of models is computed, which allows us to explore the effect of the stellar and disk parameters. Synthetic JWST-MIRI-MRS predictions are then provided and compared to the available Spitzer data. Our conclusions are the following:
For a typical T Tauri disk, the rotationally excited lines of OH are dominated by prompt emission shortward of ≃13 μm. Throughout the bulk of the disk, their intensities are proportional to the column density of water photodissociated in the 114–144 μm range. Longer wavelength OH lines could be affected by chemical pumping, which is not included in this study.
OH mid-IR emission traces a thin layer of gas typically located within 1 au and close to the H/H2 transition. For our fiducial model, this layer lies above the region that is well shielded by H2O.
OH and H2O lines, when analyzed in concert, provide important diagnostics about the distribution of dust in the upper layers and the flux of the FUV in the 114–144 nm band. OH line fluxes increase with the gas-to-dust mass ratio and the amount of FUV photons reaching the molecular layers. In particular, we show that they can constrain the amount of Lyα photons reaching the molecular layers, a parameter that remains debated. Focusing on the H2O line blend at 12.5 μm, we also find that H2O increases with the gas-to-dust ratio and the bolometric luminosity of the star.
Our model is able to reproduce H2O emission at 12.5 μm measured with Spitzer-IRS with a high gas-to-dust mass ratio. Based on these constraints, we expect OH lines to be detected by MIRI-MRS if Lyα photons reach the molecular layer, or for sources with high FUV continuum luminosity. Accurate fringe correction of the MIRI-MRS data is crucial to detect these lines against the bright dust continuum.
JWST, with its unique sensitivity and good spectral resolution, will be able to systematically probe the OH and H2O emission in T Tauri disks, as demonstrated by initial data. These data should also be supplemented by ground-based observations able to spectrally resolve the lines and measure the emitting area of OH. Detailed models including OH prompt emission will then allow key disk parameters to be constrained, for example the gas-to-dust ratio and the UV field reaching the molecular layers. These constraints will be pivotal to infer elemental abundances from the observed molecular features lying in the IR.
Data availability
The synthetic spectra convolved at the MIRI-MRS spectral resolution are available from the community on a Zenodo repository (https://doi.org/10.5281/zenodo.13333027).
Acknowledgements
We thank M. C. van Hemert and A. D. Bosman for helpful discussions and the referee for constructive feedback and suggestions that helped improve the paper. This work is part of the research programme Dutch Astrochemistry Network II with project number 614.001.751, which is (partly) financed by the Dutch Research Council (NWO). B.T. acknowledges the Paris Region fellowship program, which is supported by the Ile-de-France Region and has received funding under the Horizon 2020 innovation framework program and Marie Sklodowska-Curie grant agreement No. 945298. Part of this work was supported by the Programme National “Physique et Chimie du Milieu Interstellaire” (PCMI) of CNRS/INSU with INC/INP co-funded by CEA and CNES. E.v.D. acknowledges the funding from the European Research Council (ERC) under the European Union’s Horizon 2020 research and innovation program (grant agreement No. 291141 MOLDISK).
Appendix A Intensity profiles
 |
Fig. A.1 Intensity profiles of the OH line at 10.07 μm (top row) and the H2O line at 12.52 μm (bottom row) depending on a) the luminosity of the star, b) the accretion luminosity, and c) the gas-to-dust mass ratio. The other parameters are fixed to their fiducial values (see Table 1). |
Appendix B Comparision between Spitzer-IRS and DALI models
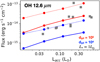 |
Fig. B.1 Predictions of the DALI model and Spitzer-IRS line fluxes of OH at 12.6 μm. The Spitzer-IRS line fluxes from Banzatti et al. (2017), represented by gray makers (triangles for upper limits and squares for detections), are well matched by dust-depleted disk atmospheres. |
References
- Ádámkovics, M., Glassgold, A. E., & Najita, J. R. 2014, ApJ, 786, 135 [CrossRef] [Google Scholar]
- Ádámkovics, M., Najita, J. R., & Glassgold, A. E. 2016, ApJ, 817, 82 [CrossRef] [Google Scholar]
- Antonellini, S., Kamp, I., Riviere-Marichalar, P., et al. 2015, A&A, 582, A105 [NASA ADS] [CrossRef] [EDP Sciences] [Google Scholar]
- Aoyama, Y., Ikoma, M., & Tanigawa, T. 2018, ApJ, 866, 84 [NASA ADS] [CrossRef] [Google Scholar]
- Argyriou, I., Wells, M., Glasse, A., et al. 2020, A&A, 641, A150 [NASA ADS] [CrossRef] [EDP Sciences] [Google Scholar]
- Banzatti, A., & Pontoppidan, K. M. 2015, ApJ, 809, 167 [NASA ADS] [CrossRef] [Google Scholar]
- Banzatti, A., Pontoppidan, K. M., Salyk, C., et al. 2017, ApJ, 834, 152 [NASA ADS] [CrossRef] [Google Scholar]
- Banzatti, A., Pascucci, I., Bosman, A. D., et al. 2020, ApJ, 903, 124 [NASA ADS] [CrossRef] [Google Scholar]
- Bergin, E., Calvet, N., D’Alessio, P., & Herczeg, G. J. 2003, ApJ, 591, L159 [Google Scholar]
- Berné, O., Martin-Drumel, M.-A., Schroetter, I., et al. 2023, Nature, 621, 56 [CrossRef] [Google Scholar]
- Bethell, T., & Bergin, E. 2009, Science, 326, 1675 [NASA ADS] [CrossRef] [Google Scholar]
- Bethell, T. J., & Bergin, E. A. 2011, ApJ, 739, 78 [NASA ADS] [CrossRef] [Google Scholar]
- Blevins, S. M., Pontoppidan, K. M., Banzatti, A., et al. 2016, ApJ, 818, 22 [NASA ADS] [CrossRef] [Google Scholar]
- Bosman, A. D., Bruderer, S., & van Dishoeck, E. F. 2017, A&A, 601, A36 [NASA ADS] [CrossRef] [EDP Sciences] [Google Scholar]
- Bosman, A. D., Tielens, A. G. G. M., & van Dishoeck, E. F. 2018, A&A, 611, A80 [NASA ADS] [CrossRef] [EDP Sciences] [Google Scholar]
- Bosman, A. D., Banzatti, A., Bruderer, S., et al. 2019, A&A, 631, A133 [NASA ADS] [CrossRef] [EDP Sciences] [Google Scholar]
- Bosman, A. D., Bergin, E. A., Calahan, J., & Duval, S. E. 2022a, ApJ, 930, L26 [NASA ADS] [CrossRef] [Google Scholar]
- Bosman, A. D., Bergin, E. A., Calahan, J. K., & Duval, S. E. 2022b, ApJ, 933, L40 [NASA ADS] [CrossRef] [Google Scholar]
- Brooke, J. S. A., Bernath, P. F., Western, C. M., et al. 2016, J. Quant. Spectr. Rad. Transf., 168, 142 [NASA ADS] [CrossRef] [Google Scholar]
- Brown, J. M., Blake, G. A., Dullemond, C. P., et al. 2007, ApJ, 664, L107 [Google Scholar]
- Bruderer, S. 2013, A&A, 559, A46 [NASA ADS] [CrossRef] [EDP Sciences] [Google Scholar]
- Bruderer, S., van Dishoeck, E. F., Doty, S. D., & Herczeg, G. J. 2012, A&A, 541, A91 [NASA ADS] [CrossRef] [EDP Sciences] [Google Scholar]
- Bruderer, S., Harsono, D., & van Dishoeck, E. F. 2015, A&A, 575, A94 [NASA ADS] [CrossRef] [EDP Sciences] [Google Scholar]
- Calahan, J. K., Bergin, E. A., & Bosman, A. D. 2022, ApJ, 934, L14 [NASA ADS] [CrossRef] [Google Scholar]
- Carr, J. S., & Najita, J. R. 2008, Science, 319, 1504 [Google Scholar]
- Carr, J. S., & Najita, J. R. 2011, ApJ, 733, 102 [NASA ADS] [CrossRef] [Google Scholar]
- Carr, J. S., & Najita, J. R. 2014, ApJ, 788, 66 [NASA ADS] [CrossRef] [Google Scholar]
- Cazaux, S., & Tielens, A. G. G. M. 2004, ApJ, 604, 222 [NASA ADS] [CrossRef] [Google Scholar]
- Cazzoletti, P., van Dishoeck, E. F., Visser, R., Facchini, S., & Bruderer, S. 2018, A&A, 609, A93 [NASA ADS] [CrossRef] [EDP Sciences] [Google Scholar]
- Chokshi, A., Tielens, A. G. G. M., & Hollenbach, D. 1993, ApJ, 407, 806 [Google Scholar]
- Cleeves, L. I., Bergin, E. A., & Harries, T. J. 2015, ApJ, 807, 2 [NASA ADS] [CrossRef] [Google Scholar]
- Cridland, A. J., Eistrup, C., & van Dishoeck, E. F. 2019a, A&A, 627, A127 [Google Scholar]
- Cridland, A. J., van Dishoeck, E. F., Alessi, M., & Pudritz, R. E. 2019b, A&A, 632, A63 [NASA ADS] [CrossRef] [EDP Sciences] [Google Scholar]
- Cridland, A. J., van Dishoeck, E. F., Alessi, M., & Pudritz, R. E. 2020, A&A, 642, A229 [NASA ADS] [CrossRef] [EDP Sciences] [Google Scholar]
- Dawson, R. I., & Johnson, J. A. 2018, ARA&A, 56, 175 [Google Scholar]
- Dutrey, A., Semenov, D., Chapillon, E., et al. 2014, in Protostars and Planets VI, eds. H. Beuther, R. S. Klessen, C. P. Dullemond, & T. Henning (Tucson: University of Arizona Press), 317 [Google Scholar]
- Duval, S. E., Bosman, A. D., & Bergin, E. A. 2022, ApJ, 934, L25 [NASA ADS] [CrossRef] [Google Scholar]
- Faure, A., & Josselin, E. 2008, A&A, 492, 257 [NASA ADS] [CrossRef] [EDP Sciences] [Google Scholar]
- France, K., Schindhelm, R., Bergin, E. A., Roueff, E., & Abgrall, H. 2014, ApJ, 784, 127 [NASA ADS] [CrossRef] [Google Scholar]
- France, K., Roueff, E., & Abgrall, H. 2017, ApJ, 844, 169 [NASA ADS] [CrossRef] [Google Scholar]
- Furlan, E., Hartmann, L., Calvet, N., et al. 2006, ApJS, 165, 568 [CrossRef] [Google Scholar]
- Gail, H.-P., & Trieloff, M. 2017, A&A, 606, A16 [NASA ADS] [CrossRef] [EDP Sciences] [Google Scholar]
- Gasman, D., Argyriou, I., Sloan, G. C., et al. 2023a, A&A, 673, A102 [NASA ADS] [CrossRef] [EDP Sciences] [Google Scholar]
- Gasman, D., van Dishoeck, E. F., Grant, S. L., et al. 2023b, A&A, 679, A117 [NASA ADS] [CrossRef] [EDP Sciences] [Google Scholar]
- Geers, V. C., Augereau, J. C., Pontoppidan, K. M., et al. 2006, A&A, 459, 545 [NASA ADS] [CrossRef] [EDP Sciences] [Google Scholar]
- Glasse, A., Rieke, G. H., Bauwens, E., et al. 2015, PASP, 127, 686 [NASA ADS] [CrossRef] [Google Scholar]
- Glassgold, A. E., & Najita, J. R. 2015, ApJ, 810, 125 [NASA ADS] [CrossRef] [Google Scholar]
- Glassgold, A. E., Meijerink, R., & Najita, J. R. 2009, ApJ, 701, 142 [NASA ADS] [CrossRef] [Google Scholar]
- Grant, S. L., van Dishoeck, E. F., Tabone, B., et al. 2023, ApJ, 947, L6 [NASA ADS] [CrossRef] [Google Scholar]
- Greenwood, A. J., Kamp, I., Waters, L. B. F. M., Woitke, P., & Thi, W. F. 2019, A&A, 626, A6 [NASA ADS] [CrossRef] [EDP Sciences] [Google Scholar]
- Harich, S. A., Hwang, D. W. H., Yang, X., et al. 2000, J. Chem. Phys., 113, 10073 [CrossRef] [Google Scholar]
- Henning, T., Kamp, I., Samland, M., et al. 2024, PASP, 136, 054302 [NASA ADS] [CrossRef] [Google Scholar]
- Kennedy, G. M., & Kenyon, S. J. 2008, ApJ, 673, 502 [Google Scholar]
- Kłos, J., Lique, F., & Alexander, M. H. 2007, Chem. Phys. Lett., 445, 12 [CrossRef] [Google Scholar]
- Kóspál, Á., Ábrahám, P., Diehl, L., et al. 2023, ApJ, 945, L7 [CrossRef] [Google Scholar]
- Krijt, S., Ciesla, F. J., & Bergin, E. A. 2016, ApJ, 833, 285 [Google Scholar]
- Krijt, S., Kama, M., McClure, M., et al. 2023, Protostars and Planets VII, Proceedings of a conference held 10-15 April 2023 at Kyoto, Japan, eds. S.-i. Inutsuka, Y. Aikawa, T. Muto, K. Tomida, & M. Tamura (San Francisco: Astronomical Society of the Pacific), ASP Conf. Ser., 534, 1031 [NASA ADS] [Google Scholar]
- Leemker, M., van’t Hoff, M. L. R., Trapman, L., et al. 2021, A&A, 646, A3 [EDP Sciences] [Google Scholar]
- Madhusudhan, N. 2019, ARA&A, 57, 617 [NASA ADS] [CrossRef] [Google Scholar]
- Manara, C. F., Ansdell, M., Rosotti, G. P., et al. 2023, Protostars and Planets VII, Proceedings of a conference held 10-15 April 2023 at Kyoto, Japan, eds. S.-i. Inutsuka, Y. Aikawa, T. Muto, K. Tomida, & M. Tamura (San Francisco: Astronomical Society of the Pacific), ASP Conf. Ser., 534, 539 [NASA ADS] [Google Scholar]
- Meijerink, R., Pontoppidan, K. M., Blake, G. A., Poelman, D. R., & Dullemond, C. P. 2009, ApJ, 704, 1471 [Google Scholar]
- Morbidelli, A., & Raymond, S. N. 2016, J. Geophys. Res. Planets, 121, 1962 [Google Scholar]
- Najita, J. R., Carr, J. S., Strom, S. E., et al. 2010, ApJ, 712, 274 [NASA ADS] [CrossRef] [Google Scholar]
- Najita, J. R., Carr, J. S., Pontoppidan, K. M., et al. 2013, ApJ, 766, 134 [Google Scholar]
- Notsu, S., Nomura, H., Ishimoto, D., et al. 2016, ApJ, 827, 113 [Google Scholar]
- Notsu, S., Akiyama, E., Booth, A., et al. 2019, ApJ, 875, 96 [Google Scholar]
- Öberg, K. I., & Bergin, E. A. 2021, Phys. Rep., 893, 1 [Google Scholar]
- Öberg, K. I., Murray-Clay, R., & Bergin, E. A. 2011, ApJ, 743, L16 [Google Scholar]
- Pascucci, I., Apai, D., Luhman, K., et al. 2009, ApJ, 696, 143 [Google Scholar]
- Pascucci, I., Herczeg, G., Carr, J. S., & Bruderer, S. 2013, ApJ, 779, 178 [NASA ADS] [CrossRef] [Google Scholar]
- Perotti, G., Christiaens, V., Henning, T., et al. 2023, Nature, 620, 516 [NASA ADS] [CrossRef] [Google Scholar]
- Pontoppidan, K. M., Salyk, C., Blake, G. A., et al. 2010, ApJ, 720, 887 [CrossRef] [Google Scholar]
- Pontoppidan, K. M., Salyk, C., Bergin, E. A., et al. 2014, in Protostars and Planets VI, eds. H. Beuther, R. S. Klessen, C. P. Dullemond, & T. Henning (Tucson: University of Arizona Press), 363 [Google Scholar]
- Pontoppidan, K. M., Salyk, C., Banzatti, A., et al. 2024, ApJ, 963, 158 [NASA ADS] [CrossRef] [Google Scholar]
- Salyk, C., Pontoppidan, K. M., Blake, G. A., et al. 2008, ApJ, 676, L49 [NASA ADS] [CrossRef] [Google Scholar]
- Salyk, C., Pontoppidan, K. M., Blake, G. A., Najita, J. R., & Carr, J. S. 2011, ApJ, 731, 130 [Google Scholar]
- Salyk, C., Lacy, J. H., Richter, M. J., et al. 2015, ApJ, 810, L24 [NASA ADS] [CrossRef] [Google Scholar]
- Salyk, C., Lacy, J., Richter, M., et al. 2019, ApJ, 874, 24 [NASA ADS] [CrossRef] [Google Scholar]
- Schindhelm, R., France, K., Herczeg, G. J., et al. 2012, ApJ, 756, L23 [NASA ADS] [CrossRef] [Google Scholar]
- Schoonenberg, D., & Ormel, C. W. 2017, A&A, 602, A21 [NASA ADS] [CrossRef] [EDP Sciences] [Google Scholar]
- Song, L., Balakrishnan, N., Walker, K. M., et al. 2015, ApJ, 813, 96 [NASA ADS] [CrossRef] [Google Scholar]
- Tabone, B., Godard, B., Pineau des Forêts, G., Cabrit, S., & van Dishoeck, E. F. 2020, A&A, 636, A60 [NASA ADS] [CrossRef] [EDP Sciences] [Google Scholar]
- Tabone, B., van Hemert, M. C., van Dishoeck, E. F., & Black, J. H. 2021, A&A, 650, A192 [NASA ADS] [CrossRef] [EDP Sciences] [Google Scholar]
- Tabone, B., Bettoni, G., van Dishoeck, E. F., et al. 2023, Nat. Astron., 7, 805 [NASA ADS] [CrossRef] [Google Scholar]
- Tappe, A., Lada, C. J., Black, J. H., & Muench, A. A. 2008, ApJ, 680, L117 [Google Scholar]
- Trapman, L., Facchini, S., Hogerheijde, M. R., van Dishoeck, E. F., & Bruderer, S. 2019, A&A, 629, A79 [NASA ADS] [CrossRef] [EDP Sciences] [Google Scholar]
- van Dishoeck, E. F., & Black, J. H. 1986, ApJS, 62, 109 [Google Scholar]
- van Dishoeck, E. F., Grant, S., Tabone, B., et al. 2023, Faraday Discussions, 245, 52 [NASA ADS] [CrossRef] [Google Scholar]
- van Harrevelt, R., & van Hemert, M. C. 2000, J. Chem. Phys., 112, 5787 [NASA ADS] [CrossRef] [Google Scholar]
- van Harrevelt, R., & van Hemert, M. C. 2001, J. Chem. Phys., 114, 9453 [NASA ADS] [CrossRef] [Google Scholar]
- van Harrevelt, R., & van Hemert, M. C. 2003, Chem. Phys. Lett., 370, 706 [NASA ADS] [CrossRef] [Google Scholar]
- Walker, K. M., Song, L., Yang, B. H., et al. 2015, ApJ, 811, 27 [NASA ADS] [CrossRef] [Google Scholar]
- Walsh, C., Nomura, H., & van Dishoeck, E. 2015, A&A, 582, A88 [NASA ADS] [CrossRef] [EDP Sciences] [Google Scholar]
- Woitke, P., Kamp, I., & Thi, W. F. 2009, A&A, 501, 383 [NASA ADS] [CrossRef] [EDP Sciences] [Google Scholar]
- Woitke, P., Min, M., Thi, W. F., et al. 2018, A&A, 618, A57 [NASA ADS] [CrossRef] [EDP Sciences] [Google Scholar]
- Woitke, P., Arabhavi, A. M., Kamp, I., & Thi, W. F. 2022, A&A, 668, A164 [NASA ADS] [CrossRef] [EDP Sciences] [Google Scholar]
- Yang, B., Stancil, P. C., Balakrishnan, N., & Forrey, R. C. 2010, ApJ, 718, 1062 [Google Scholar]
- Yousefi, M., Bernath, P. F., Hodges, J., & Masseron, T. 2018, J. Quant. Spectr. Rad. Transf., 217, 416 [NASA ADS] [CrossRef] [Google Scholar]
- Zannese, M., Tabone, B., Habart, E., et al. 2023, A&A, 671, A41 [NASA ADS] [CrossRef] [EDP Sciences] [Google Scholar]
- Zannese, M., Tabone, B., Habart, E., et al. 2024, Nature Astronomy, 8, 577 [NASA ADS] [CrossRef] [Google Scholar]
- Zhou, L., Xie, D., & Guo, H. 2015, J. Chem. Phys., 142, 124317 [CrossRef] [Google Scholar]
Available at: https://doi.org/10.5281/zenodo.13333027.
All Tables
All Figures
|
Fig. 1 Synthetic spectrum of OH (red and purple) and H2O (blue) for the fiducial model, at typical MIRI-MRS spectral resolution (R = 2500) with (top) and without (bottom, shifted by 0.2 Jy) OH prompt emission. OH is primarily excited by H2O photodissociation producing highly excited lines down to 9 μm. The OH lines are seen on top of the continuum and embedded in the strong H2O line forest. The OH prompt emission produces OH in the A′ symmetric states resulting in an imbalance in the four components of each rotational transition. Longward of ≃13.5 μm, we expect OH chemical pumping by O+H2 to impact the OH lines, a process that is not included in this version of our model. |
| In the text | |
|
Fig. 2 Radial profile of the emission of the 10.07 μm OH line and of the H2O column density photodissociated per unit time in the 114–144 nm FUV range. Throughout the disk, the line intensity is proportional to the amount of H2O locally photodissociated via the |
| In the text | |
|
Fig. 3 Disk thermochemical structure of our fiducial model. The emitting area of the rotationally excited OH line at 10.07 μm and the H2O line at 12.519 μm are overplotted on the distribution of the gas-phase water abundance in the disk (color map) and the local FUV radiation field attenuated by gas and dust (black contours) for our fiducial model. |
| In the text | |
|
Fig. 4 Physical and chemical structure of the irradiated layer at r = 0.3 au for our fiducial disk model. |
| In the text | |
|
Fig. 5 Synthetic spectrum of H2O and OH emission depending on the luminosity of the star, the accretion luminosity, the contribution of Lyα photons, and the gas-to-dust mass ratio. We recall that the fiducial model is a disk with a gas-to-dust mass ratio of dgd = 105 orbiting a T Tauri star with a stellar luminosity of L* = 1 L⊙, an accretion luminosity of Lacc = 0.12 L⊙, and no contribution of Lyα to the impinging FUV field. The scales in panels d) and e) are different, highlighting the strong impact of the putative Lyα photons and the gas-to-dust ratio. |
| In the text | |
|
Fig. 6 Effect of the stellar and disk parameters on the OH and H2O emission. OH is primarily sensitive to the stellar FUV flux, which depends on Lacc, on the inclusion of Lyα photons, and on the gas-to-dust ratio. The H2O line flux is sensitive to the bolometric luminosity of the star and the gas-to-dust ratio. In this figure the reference value of the parameters that are kept constant are dgd = 104, L* = 1 L⊙, and Lacc = 0.12 L⊙. The line fluxes are calculated by integrating the H2O emission from 12.5 to 12.537 μm and the OH emission from 10.05 to 10.08 μm. |
| In the text | |
|
Fig. 7 Predictions for JWST-MIRI-MRS. (a) Comparison between Spitzer-IRS fluxes of the H2O blend at 12.5 μm and our DALI models for two values of gas-to-dust mass ratio. Spitzer-IRS fluxes, represented by gray markers (triangles for upper limits and squares for detections), are well matched by dust-depleted disk atmospheres. The accretion luminosity is set to its fiducial value of Lacc = 0.12 L⊙, recalling that Lacc has little effect on H2O line fluxes. (b) OH line fluxes at 10.07 μm as a function of Lacc. For dust depletion factors in line with Spitzer-IRS water line fluxes and without considering MIRI-MRS fringes, OH is expected to be detected. (c) The contrast between the OH line at 10.07 μm and the continuum. The gray area shows the typical residual noise after a psff fringe correction (Gasman et al. 2023a) or calibration with observations of asteroids (Pontoppidan et al. 2024). |
| In the text | |
|
Fig. A.1 Intensity profiles of the OH line at 10.07 μm (top row) and the H2O line at 12.52 μm (bottom row) depending on a) the luminosity of the star, b) the accretion luminosity, and c) the gas-to-dust mass ratio. The other parameters are fixed to their fiducial values (see Table 1). |
| In the text | |
|
Fig. B.1 Predictions of the DALI model and Spitzer-IRS line fluxes of OH at 12.6 μm. The Spitzer-IRS line fluxes from Banzatti et al. (2017), represented by gray makers (triangles for upper limits and squares for detections), are well matched by dust-depleted disk atmospheres. |
| In the text | |
Current usage metrics show cumulative count of Article Views (full-text article views including HTML views, PDF and ePub downloads, according to the available data) and Abstracts Views on Vision4Press platform.
Data correspond to usage on the plateform after 2015. The current usage metrics is available 48-96 hours after online publication and is updated daily on week days.
Initial download of the metrics may take a while.