Open Access
Fig. A.1.
Download original image
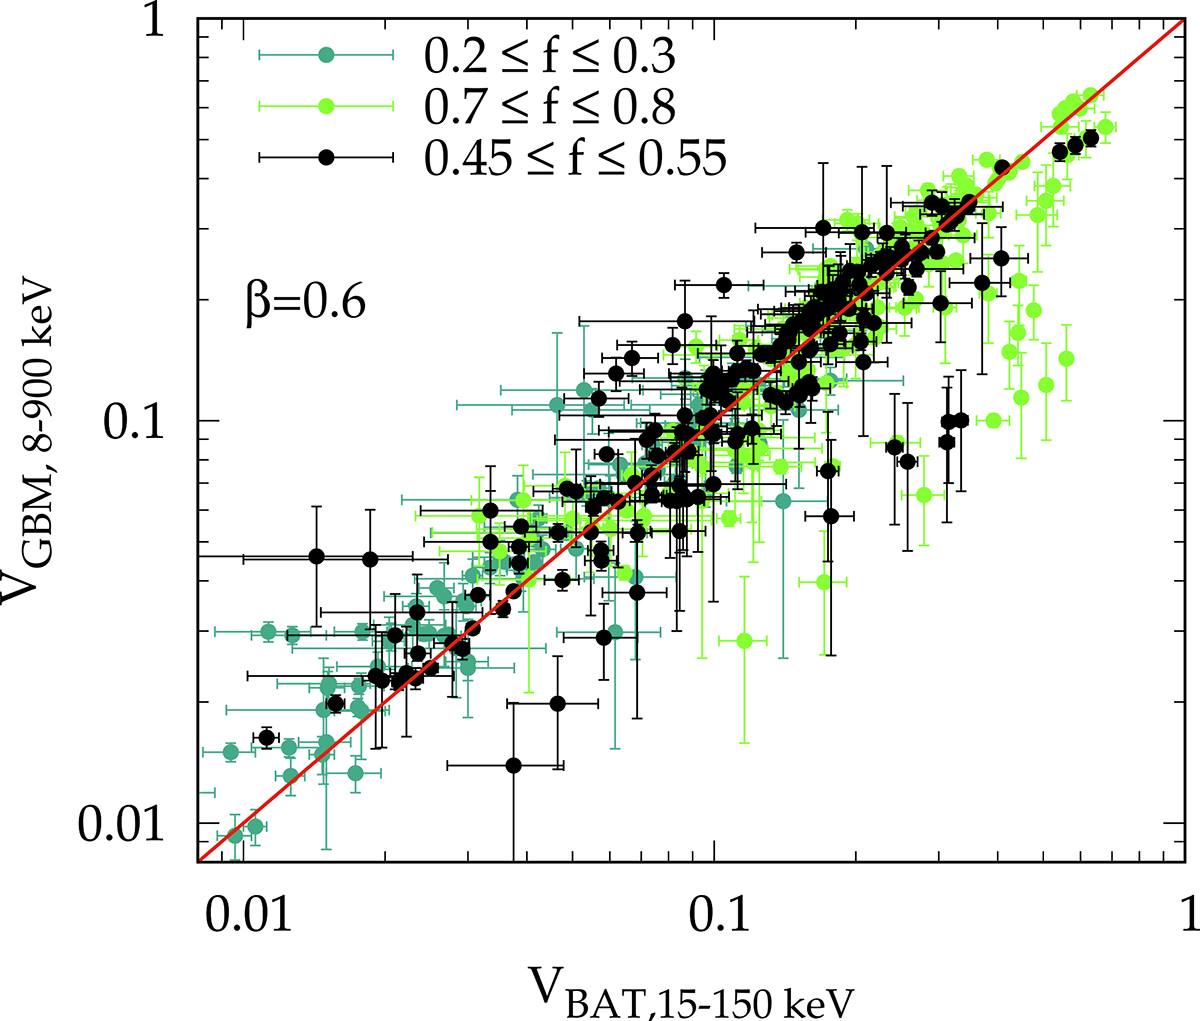
Comparison between estimates of variability obtained with BAT in the 15–150 keV band vs. the GBM estimates in the 8–900 keV band, obtained for a common sample with significant measures of variability. Three different ranges for f are shown.
Current usage metrics show cumulative count of Article Views (full-text article views including HTML views, PDF and ePub downloads, according to the available data) and Abstracts Views on Vision4Press platform.
Data correspond to usage on the plateform after 2015. The current usage metrics is available 48-96 hours after online publication and is updated daily on week days.
Initial download of the metrics may take a while.