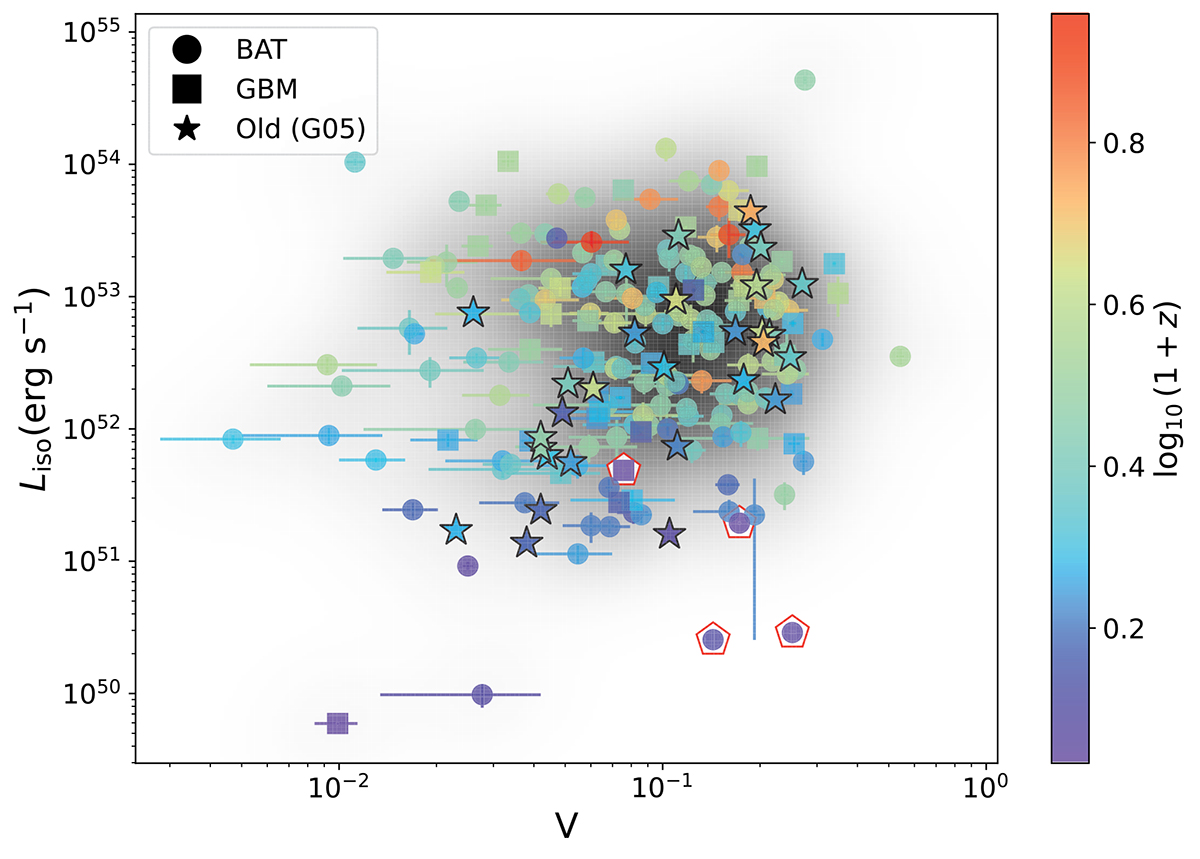
Fig. 4.
Download original image
Variability–luminosity correlation obtained for f = 0.45 and β = 0.6. In addition to the 184 GRBs analysed in the present work, we also show (stars) GRBs from G05. The redshift is colour-coded. The shaded region shows a density map, obtained using a kernel density estimate, of the same data set (excluding the G05 GRBs). The four GRBs with red pentagons are long-duration merger candidates (GRB 060614, GRB 191019A, GRB 211211A, and GRB 230307A) that were considered separately.
Current usage metrics show cumulative count of Article Views (full-text article views including HTML views, PDF and ePub downloads, according to the available data) and Abstracts Views on Vision4Press platform.
Data correspond to usage on the plateform after 2015. The current usage metrics is available 48-96 hours after online publication and is updated daily on week days.
Initial download of the metrics may take a while.