Fig. 3.
Download original image
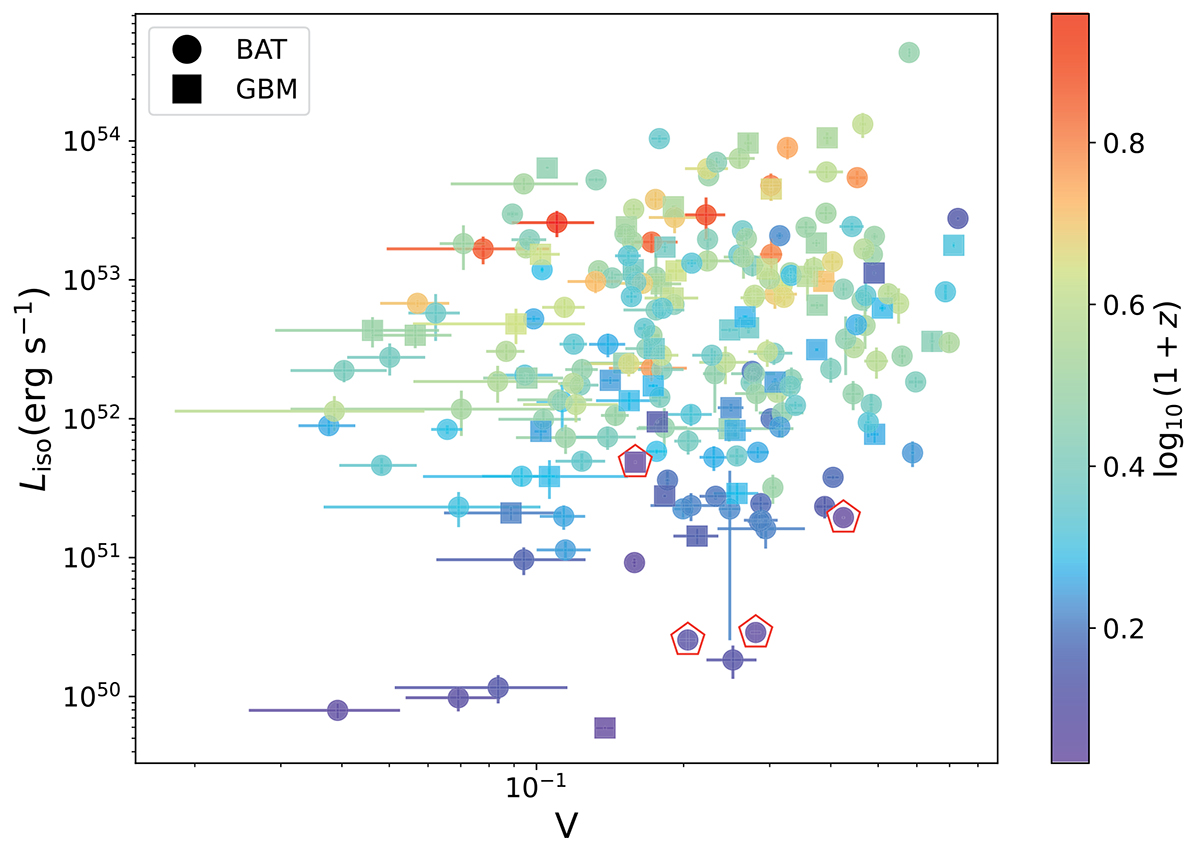
Variability–luminosity correlation obtained for f = 0.8 and β = 0.6. This value of f gives the highest degrees of correlation. Different symbols refer to the different detectors used to measure Vf. For BAT-GBM shared GRBs, we used BAT values. Pentagons represent long-duration merger candidates. The redshift information is also available through the colour-coded scale.
Current usage metrics show cumulative count of Article Views (full-text article views including HTML views, PDF and ePub downloads, according to the available data) and Abstracts Views on Vision4Press platform.
Data correspond to usage on the plateform after 2015. The current usage metrics is available 48-96 hours after online publication and is updated daily on week days.
Initial download of the metrics may take a while.