Open Access
Fig. 1.
Download original image
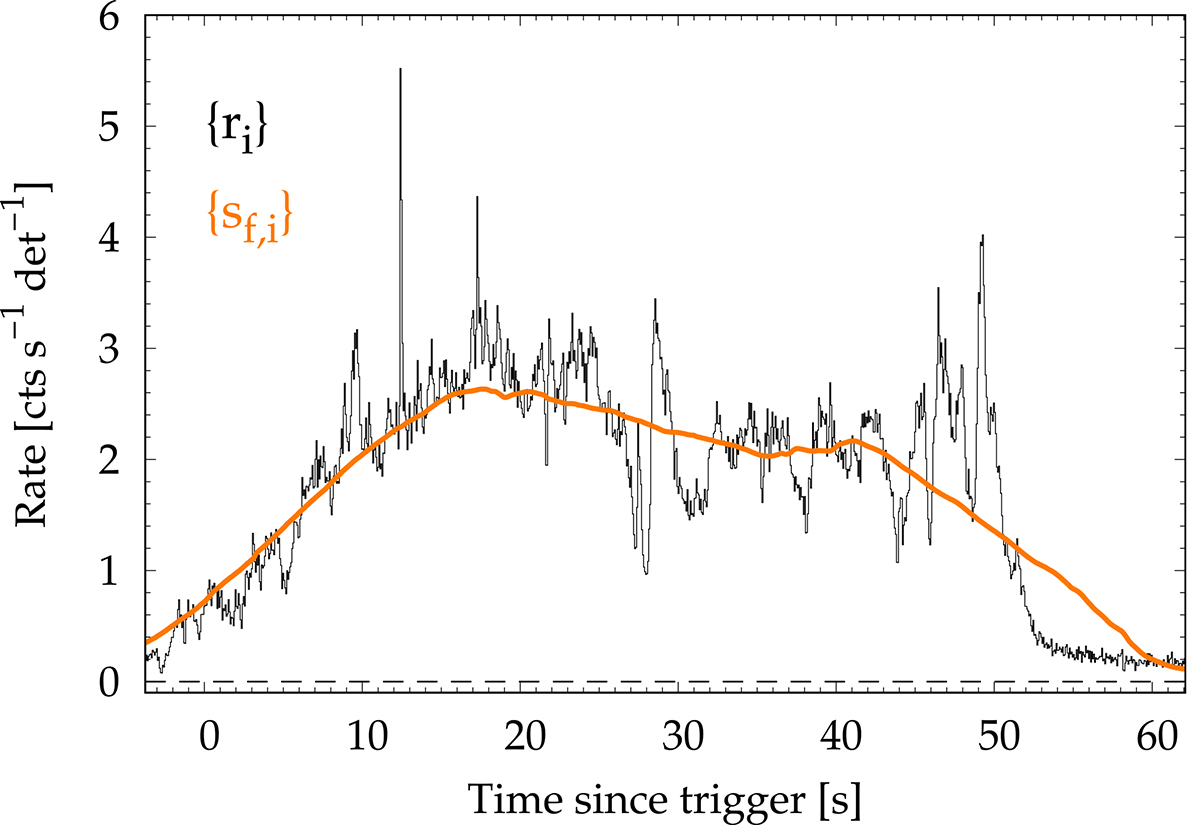
Calculation of the variability. We show the 15–150-keV light curve {ri} of GRB 080319B as observed with BAT. The orange line shows the smoothed profile {sf, i} obtained with a smoothing timescale of Tf = 18.43 s, which collects a fraction f = 0.45 of the total fluence of the GRB.
Current usage metrics show cumulative count of Article Views (full-text article views including HTML views, PDF and ePub downloads, according to the available data) and Abstracts Views on Vision4Press platform.
Data correspond to usage on the plateform after 2015. The current usage metrics is available 48-96 hours after online publication and is updated daily on week days.
Initial download of the metrics may take a while.