Open Access
Fig. 2
Download original image
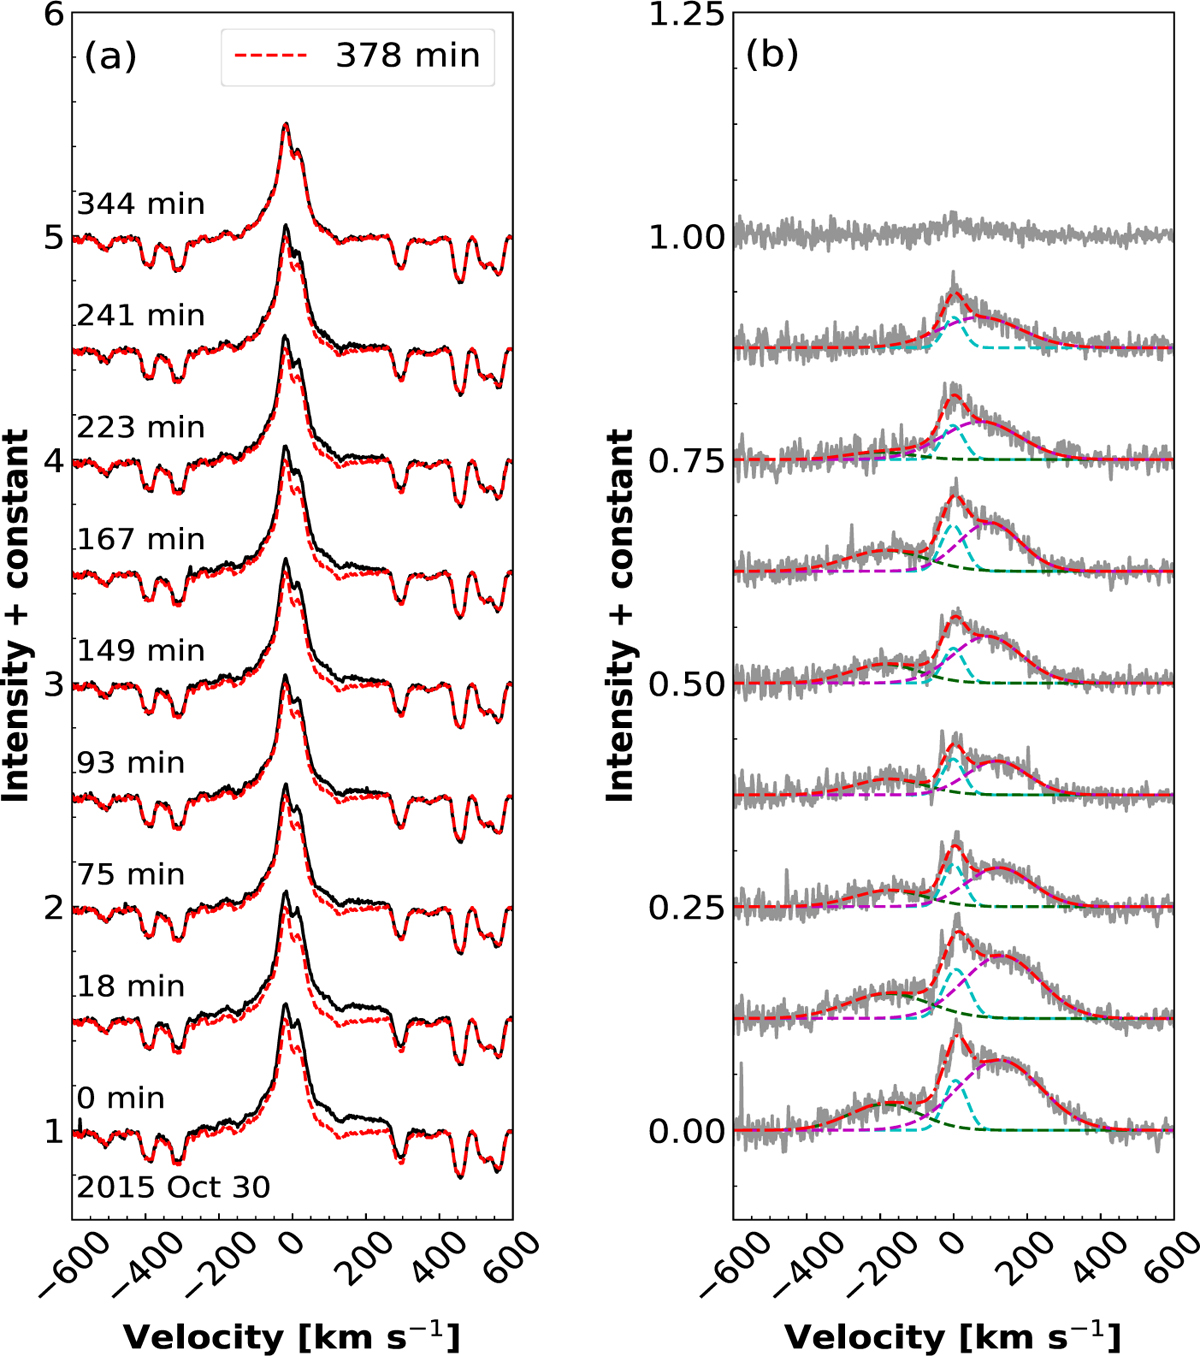
Time variation of the Hα spectrum. (a) The first nine Hα spectra (black solid lines) are compared with the last one. The red dashed line represents the last spectrum observed at phase 0.809. (b) The Hα residuals between the first nine spectra and the last spectrum are shown and fitted using Gaussian fitting (dashed lines).
Current usage metrics show cumulative count of Article Views (full-text article views including HTML views, PDF and ePub downloads, according to the available data) and Abstracts Views on Vision4Press platform.
Data correspond to usage on the plateform after 2015. The current usage metrics is available 48-96 hours after online publication and is updated daily on week days.
Initial download of the metrics may take a while.