| Issue |
A&A
Volume 690, October 2024
|
|
|---|---|---|
| Article Number | A90 | |
| Number of page(s) | 7 | |
| Section | Atomic, molecular, and nuclear data | |
| DOI | https://doi.org/10.1051/0004-6361/202450883 | |
| Published online | 27 September 2024 | |
X-ray photo-desorption of NH3 and N2 from ammonia ices: Mechanisms and yields in protoplanetary disks
1
Université Paris-Saclay, CNRS, ISMO,
91405
Orsay,
France
2
Sorbonne Université CNRS, MONARIS, UMR8233,
75005
Paris,
France
e-mail: This email address is being protected from spambots. You need JavaScript enabled to view it.
★ Corresponding author; This email address is being protected from spambots. You need JavaScript enabled to view it.
Received:
27
May
2024
Accepted:
22
August
2024
Abstract
Context. Ammonia is detected both in the gas phase and in the ices of protoplanetary disks. However, its gas phase abundances are still difficult to reproduce via chemical modelling when only the thermal-, UV photon-, and cosmic ray-induced processes are considered. Among other non-thermal mechanisms, X-ray photo-desorption is a relevant pathway to maintaining a budget of molecules in the gas of disks. However, no quantitative data are available to constrain its efficiency in the case of ammonia-containing ices.
Aims. We studied the desorption induced by soft X-rays from ammonia ices to determine the photo-desorption yields of neutral molecules that can be applied to the conditions of protoplanetary disks. We also aim to identify the desorption mechanisms at play.
Methods. Pure ammonia ices were deposited at 23 or 75 K and irradiated between 395 and 435 eV, with monochromatic synchrotron light. Desorption of neutral molecules and fragments was detected using a quadrupole mass spectrometer, calibrated to obtain des-orption yields. These values were extrapolated and the spectrum of a protoplanetary disk was used to extract average astrophysical desorption yields.
Results. Photo-desorption from NH3 ices is dominated by the desorption of neutral NH3 and N2 molecules. The desorption mechanism mostly involves the thermalisation of Auger electrons in the ice, although resonant phenomena also contribute near the N 1s ionisation edge. The NH3 photo-desorption is independent of ice morphology and irradiation temperature. Contrary to NH3 desorption, N2 desorption is sensitive to the photon fluence received by the ice. Average photo-desorption yields derived using the TW Hya X-ray spectrum reveal that the NH3 photo-desorption would be four to six times more efficient than that of H2O. This could be at the origin of unexplained high NH3/H2O abundance ratios predicted in the disk around TW Hya. This result ought to be confirmed by the study of mixed water-ammonia ices.
Key words: astrochemistry / methods: laboratory: molecular / methods: laboratory: solid state / protoplanetary disks
Current affiliation: Laboratory Astrophysics Group of the Max Planck Institute for Astronomy at the Friedrich Schiller University Jena, Institute of Solid State Physics, Jena, Germany.
© The Authors 2024
 Open Access article, published by EDP Sciences, under the terms of the Creative Commons Attribution License (https://creativecommons.org/licenses/by/4.0), which permits unrestricted use, distribution, and reproduction in any medium, provided the original work is properly cited.
This article is published in open access under the Subscribe to Open model. This email address is being protected from spambots. You need JavaScript enabled to view it. to support open access publication.
1 Introduction
Ammonia is ubiquitous in astrophysical media. Its presence in the solar system has been known for a long time as a component of the atmospheres of gas giants (e.g. Cochran & Cochran 1981; Hofstadter & Muhleman 1989) and comets (e.g. Wyckoff et al. 1991; Drozdovskaya et al. 2023) or frozen on the surface of several bodies such as Enceladus (Emery et al. 2005) or Charon (Brown & Calvin 2000). In the interstellar medium, it is considered an important nitrogen carrier in molecular clouds and circumstellar envelopes, together with N2 and HCN (Pontoppidan et al. 2019). Also, NH3 has been identified as one of the main constituents of the molecular icy mantles covering dust grains (Öberg et al. 2011; Boogert et al. 2015). Recent observations performed by the James Webb Space Telescope have further confirmed its presence in ice mantles in dense clouds (McClure et al. 2023), where it accounts for 2–10% of the composition relative to water, and, more recently, in protoplanetary disks (Sturm et al. 2023). In the latter regions, the presence of NH3 in the gas phase has been observationally confirmed (Salinas et al. 2016; Najita et al. 2021). In the case of the disk around TW Hya, Salinas et al. (2016) considered ammonia emission to be spatially correlated to water emission. They derived gaseous NH3/H2O ratios using the observations and the chemical model from Cleeves et al. (2015), which takes into account both thermal desorption and non-thermal desorption induced by UV photons and cosmic rays; with the X-rays in this case mainly considered for the ionisation processes and secondary UV photon generation. Said ratios were high in three of the four tested scenarios, implying that additional processes must be considered to explain the gas phase ammonia abundances. In the fourth considered scenario, water and ammonia are mainly present in the midplane of the disk where UV photons cannot penetrate, therefore ruling out the effect of UV photo-desorption and requiring another non-thermal desorption process to be at play.
Although desorption induced by X-ray photons has been a known phenomenon for several decades (Brumbach & Kaminsky 1976), it has gained interest more recently as a relevant process in astrochemistry. The ability of soft X-ray photons to induce chemical changes in irradiated molecular solids and desorption of neutral molecules from interstellar ice analogues has been experimentally evidenced (see e.g. Ciaravella et al. 2020; Chen et al. 2013, and references below), making X-ray-induced desoгption a good candidate to explain gaseous abundances, especially in protoplanetary disks and in regions where UV photons can hardly penetrate. The diffusion and mixing of species present in the ice induced by X-ray irradiation has also been shown to occur (Jiménez-Escobar et al. 2022).
In particular, the X-ray photo-desorption yields from water ice, experimentally measured by Dupuy et al. (2018), have led to the consideration of this process for the determination of gaseous H2O abundances in disks. For instance, Notsu et al. (2021) showed the strong impact of the X-ray-induced photo-desorption on the water abundances outside the snowline. X-ray irradiation experiments on NH3-containing ices have also been performed over the years, but, to our knowledge, no values have been reported for desorption yields of neutral molecules. Jiménez-Escobar et al. (2018) showed that X-ray irradiation of a H2O:CO:NH3 ice mixture leads to the desorption of NH3 and N2 (among other molecules), but no quantitative desorption yields have been given, apart for an upper limit for CO desorption. Parent et al. (2009) studied the modification of crystalline ammonia ice irradiated with 150 eV photons at 20 K. Their near-edge X-ray absorption fine structure (NEXAFS) spectra taken in the 393–430 eV energy range showed that the absorption spectrum of the ice varies with increasing irradiation dose, mainly due to an accumulation of N2 in the ice. They also identified NH2, N2H2,  , and HN3 as irradiation products, similarly to what was found after UV (Gerakines et al. 1996) or 5 keV electron (Zheng et al. 2008) irradiation of pure ammonia ices. In this context, we present an experimental study aiming to derive X-ray photo-desorption yields from ammonia ices that can be applied in models of protoplanetary disks.
We have previously studied X-ray-induced desorption from water (Dupuy et al. 2020), carbon monoxide (Dupuy et al. 2021b), methanol (Basalgète et al. 2021a,b), acetonitrile (Basalgète et al. 2023), and mixed and layered N2/CO ices (Basalgète et al. 2022). These studies provided experimental evidence for the desorption of neutral molecules and fragments, including products resulting from X-ray-induced chemistry (especially in the cases of CH3OH and CH3CN). For ice mixtures, it has been established that the desorption yields depend on the ice composition (Basalgète et al. 2021b; Basalgète et al. 2023).
Regarding the desorption mechanisms at play, we demonstrated that in the case of mixed and layered N2/CO ices (Basalgète et al. 2022), the main mechanism is indirect (i.e. that the photo-absorption of a species leads to the desorption of another present in the ice). This implies an energy transfer between the molecule that absorbs the photon and the one desorbing. This energy transfer occurs over a distance determined by the mechanism, which we call desorption-relevant depth (Ades). For N2/CO layered ices, said depth was determined to be 30–40 ML, which is consistent with X-ray-induced electron stimulated desorption (XESD). This means that desorption is caused by the thermalisation of Auger electrons and photo-electrons, which create secondary electrons as well as other secondary particles in the ice1. The Auger electrons are produced by the decay of the core-excited or core-ionised states, and they carry most of the initial photon energy under the experimental conditions used in our studies. The same mechanism has been proposed to be dominant in the case of neutral desorption from other molecular ices such as water and methanol. For pure methanol ices, complementary electron-irradiation experiments were able to reproduce the desorption yields and the chemistry seen in X-ray irradiation, confirming that XESD is the primary desorption mechanism (Torres-Díaz et al. 2023).
The present study aims to quantify soft X-ray-induced desorption of neutral species from pure ammonia ices as a function of the photon energy. We present desorption yields between 395 and 435 eV, obtained by harnessing the high brilliance and tunability of synchrotron radiation (SOLEIL, beamline SEXTANTS, St Aubin, France). The desorption mechanisms are discussed in this work, where we also derive astrophysically relevant photo-desorption yields.
2 Methods
2.1 Set-up and irradiation experiments
All the experiments were carried out using the SPICES setup, which consists of an ultra-high vacuum chamber (base pressure ~10−10 mbar) equipped with a quadrupole mass spectrometer (QMS). The ices were prepared by vapour deposition on a copper substrate mounted on a rotary sample holder and cooled down by a closed-cycle helium cryostat. The ammonia ices were prepared at 23 K (amorphous) or at 75 K (crystalline) and kept at the respective temperature during irradiation. The deposited ice thickness was of 100 ± 10 monolayers (ML). Taking an ice density of about 0.8 g cm−3 (Satorre et al. 2013), we obtain an interlayer distance of ~3 Å and, thus, the ice thickness corresponds to about 300 Å. The vacuum chamber was connected to the SEXTANTS X-ray beamline at the SOLEIL synchrotron in Saint-Aubin, France. The ices were irradiated with X-ray photons around the N 1s edge (395–435 eV), with a typical spectral resolution of 150 meV. The energy scale was calibrated setting the N 1s → π*(ν′ = 0) transition of N2 at 400.868 eV (Chen et al. 1989). The incidence angle was 47° with respect to the surface normal and the irradiated spot area was ~0.1 cm2.
During irradiation, two types of data were recorded: i) the NEXAFS spectra in the Total Electron Yield (TEY) mode, corresponding to the drain current measured at the substrate due to the escape of the electrons created upon photo-absorption; and ii) the ion yields, corresponding to the different m/z fragments created by electron-impact ionisation (70 eV) of the neutral molecules desorbing from the ice and reaching the QMS.
The depth probed by the TEY is determined by the escape depth of electrons created upon photon absorption (Stöhr 1992) (i.e. photo-electrons, Auger and secondary electrons), and it is estimated to be around 100 Å (Parent et al. 2009). For instance, the secondary electron cloud created by 500 eV Auger electrons in water ice has a radius of 10–13 nm according to molecular dynamics simulations (Tîmneanu et al. 2004). Therefore, the deposited ice thickness is about three times the depth probed by the TEY technique.
The photon flux was measured in situ with a photo-diode and is shown to be energy-dependent. When only the TEY was recorded (as for the results shown in Fig. 1), the photon flux used was 1−2 × 10¹¹ ph s−1. For the photo-desorption experiments, when both TEY and ion yields were measured simultaneously, the flux was 1−2 × 10¹²ph s−1. Using this flux, the accumulated dose received by the ice per unit area, or fluence, was ~2 × 10¹⁶ ph cm−2 for an energy scan between 395 and 435 eV. Since consecutive energy scans were done using the same ice, we indicate the initial and final fluence values in the figures. The maximum fluence received by a given ice was ~4 × 10¹⁶ ph cm−2.
After this, a temperature programmed desorption (TPD) experiment was done (heating rate of 12 K min−1) thermally desorbing the ice from the substrate before a new ice was prepared.
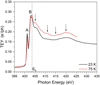 |
Fig. 1 TEY from pristine ammonia ices, deposited and measured at the indicated temperature (23 or 75 K). Features A and B are attributed to electronic transitions (see text). The N 1s binding energy (Eb = 403.6 eV) determined for ammonia clusters is taken from Lindblad et al. (2009). The photon flux is ~2 × 10¹¹ ph s−1, fluence is 0–1 × 10¹⁵ ph cm−2. |
2.2 Desorption yield determination
The detailed methods used to calculate desorption yields from the experimental data have been described previously (Basalgète et al. 2021b; Basalgète et al. 2023) and, in this work, we give a summary of the key points. The ion yields recorded with the QMS as a function of the incident photon energy are converted into quantitative desorption yields Γinc(E), in molecules per incident photon, using TPD calibrations done before the synchrotron experiments for both NH3 and N2. The relative uncertainty on the desorption yields has been estimated to be about 50% and considers uncertainties linked to the background signal subtraction, photon flux determination and the transmission function of the QMS. Fragments of m/z 16 and 17 were used to quantify NH3 desorption and m/z 28 for N2.
For the astrophysical yields, the yields were first determined between 395 and 435 eV are extrapolated up to 10 keV by assuming that they follow the photo-absorption profile of the ice. Since the absorption cross-sections for condensed ammonia have not been reported in the literature, the gas-phase atomic nitrogen’s cross sections from Saloman et al. (1988) are used. This is a reasonable approximation for energies above the ionisation threshold since the core orbital involved in the ionisation process has an atomic character (Dupuy et al. 2018). Then, the local spectrum of a Classical T Tauri star, TW Hya (Nomura et al. 2007), is used and attenuated according to different hydrogen column density conditions, by using the photo-electric cross-sections taken from Bethell & Bergin (2011). The yields per deposited eV, ΓeV(E), are calculated as follows:
 (1)
(1)
where σ is the photo-absorption cross-section at the photon energy E. N is the number of molecules involved in the photo-desorption process per surface unit (in molecules cm−2) and is calculated as:
 (2)
(2)
Here, ρm is the ice’s mass density (g cm−3), NAv Avogadro’s number (mol−1), M the molar mass (g mol−1), and Λdes the desorption-relevant depth, namely, the number of ice layers that contribute to the desorption processes. We have used the ice densities reported by Satorre et al. (2013) of 0.72 and 0.87 g cm−3 for the ices at 23 and 75 K, respectively. Finally, Λdes was determined to be several tens of monolayers (Basalgète et al. 2022) and we took a value of 60 ML for a pure ammonia ice.
3 Results
3.1 Ice photo-absorption (TEY)
The total electron yield measured around the N 1s edge for pure ammonia ices is shown in Fig. 1, for an amorphous (23 K) and a crystalline ice (75 K) in the low-fluence regime. Our results are in good agreement with the TEY reported by Parent et al. (2009) for a crystalline ice deposited at 95 K and measured at 20 K. The observed peaks at 401.2 eV (A) and at 402.9 eV (B) can be interpreted as shifted (1 to 1.5 eV) and broadened (about 50%) versions of the gas phase absorption features (Menzel et al. 1990). Therefore they are attributed, respectively, to the N 1s → 3a and to the N 1s → 3p (e) transitions, according to the notation used by Schirmer et al. (1993). The intensity of these two peaks is independent of the ice temperature and morphology. It should be noted that other resonances observed above peak B in the gas phase are not distinguishable in the TEY from the solid. To our knowledge, the core ionisation energy has not been reported for condensed ammonia; thus, in Fig. 1, we show the binding energy (Eb) of the N 1s orbital measured for ammonia clusters (Lindblad et al. 2009). The weak resonances seen in the ionisation continuum (405, 411 and 415 eV) at 75 K were attributed to multiple scattering by Parent et al. (2009) and are characteristic of an ordered solid. By analogy with the gas phase, the broad feature at higher photon energy (420 eV) is attributed to a σ-shape resonance (Sette et al. 1984).
3.2 Chemical evolution of the ice
The evolution of the photo-absorption features with increasing fluence (total number of photons received by the ice per cm2) is shown in Fig. 2. We mainly observe the formation of N2 and some depletion of NH3. The intensity of peak A (401.2 eV) increases with increasing irradiation due to the accumulation of N2 in the ice. The N 1s → π* transition of N2 overlaps with the first core excitation of NH3 (Parent et al. 2009). This is observed at both 23 and 75 K, although for the latter the accumulation is less significant, namely, the 401.2 eV peak (A) remains less intense than the 402.9 eV peak (B) in the 2 × 10¹⁶−4 × 10¹⁶ ph cm−2 fluence range (Fig. 2, blue curves). This is because at 23 K the thermal desorption of N2 is not significant, while it is expected to be efficient at 75 K. The TPD spectra of N2 deposited on amorphous water ice (ASW) showed that all the N2 is thermally desorbed even below 40 K (Smith et al. 2016). A higher resolution TEY recorded around 401 eV confirms this attribution, as the N2 vibronic transition’s structure becomes apparent (Fig. 2, panel c, green curve). The positions of the features match the ones seen in the partial electron yields (PEY) of a pure N2 ice from Feulner et al. (1992).
The formation and accumulation of N2 on and in the ice is also seen in post-irradiation TPD spectra (Fig. 3). We observe that desorption of the mass fragment 28 (N2) starts at ~27 K and peaks at 40 K for the ammonia ice irradiated at 23 K. The same was seen for mass 14 (not shown). Some N2 trapped in the ice is then released when the NH3 ice is crystallised (~75 K) which is known as the ‘volcano effect’ (Smith et al. 1997) and has been previously observed for N2 co-deposited with water (Collings et al. 2004). Finally, some N2 co-desorbs with NH3 at a higher temperature. In contrast, when the ice is irradiated at 75 K the N2 molecules cannot stick to the surface. The only N2 remaining is trapped deep in the ice. Accordingly, the only peak seen in the TPD spectra corresponds to its co-desorption with NH3.
Peak B’s evolution (402.9 eV) is more complex and not completely understood. Its intensity decreases with increasing fluence, indicating depletion of NH3, except for the blue curves in Fig. 2 that show an increase. This could be due to N2 absorption, expected above 405 eV with an intensity of around 10% of that at 401 eV (Basalgète et al. 2022) or to other irradiation products whose features are expected to overlap with the NH3 ones, such as N2H4 (Hitchcock 1990). Three new features appear between 395 and 400 eV (inlets in Fig. 2), which were attributed by Parent et al. (2009) to N=NH2 (397.2 eV), cis – N2H2 (398.6 eV),  (399.6 eV) and HN3 which overlaps with the latter.
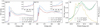 |
Fig. 2 TEY from ammonia ices over different fluence ranges, at 23 (a) and 75 K (b). The inlets in panels a and b show the TEY below 400 eV. Panel c shows a zoom-in of the ammonia TEY around 401 eV (at 75 K) compared to the partial electron yield (PEY) from a pure N2 ice from Feulner et al. (1992), in arbitrary units. N2 formation during irradiation of ammonia ices is confirmed by the appearance of the N2 vibronic structure (green trace, spectral resolution of 20 meV). The legend gives the initial and final fluences for each energy scan. The photon flux is ~2 × 10¹¹ ph s−1 for the black and green traces and ~2 × 10¹² ph s−1 for the others. |
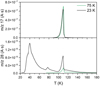 |
Fig. 3 Post-irradiation TPD. The legend gives the temperature at which the ice was deposited and kept during irradiation. Mass fragments 17 and 28 were used to follow the thermal desorption of NH3 and N2, respectively. Total fluence received by the ices ~4 × 10¹⁶ ph cm−2. Heating rate 12 K min−1. |
3.3 Desorption yields
While the TEY measurements allow detecting photon-induced changes in the ice composition, the release of neutral molecules to the gas phase was monitored by mass spectrometry during photon irradiation of the ices. We detected NH3 and N2 desorbing during X-ray irradiation at both working temperatures. The energy-dependent desorption yields in molecules per incident photon are shown in Fig. 4. We observed N2 des-orption to be strongly fluence dependent in the low-fluence regime (≤ 2 × 10¹⁶ ph cm−2); therefore, we only provide the desorption yields at high-fluence where the energy dependence is considered more reliable. The maximum desorption yield measured for N2 is almost five times the maximum yield measured for NH3. It should be noted that desorption of fragments of m/z 30 (N2H2) and 32 (N2H4) was not observed (both probed at 403 eV and low fluence, ~1 × 10¹⁵ph cm−2). Desorption of H2 was not considered in this study, as our mass spectrometer does not allow reliable quantification of the m/z 2 channel. The NH3 desorption yields are independent of the ice morphology and irradiation temperature, except at the first resonance around 401 eV. Here, the desorption is enhanced at 23 K (0.08–0.11 molecules photon−1) compared to 75 K (~0.045 molecules photon−1). According to the desorption mechanism expected to be dominant at the photon energies studied here (XESD), we scale the TEY to match the desorption yields at the ionisation continuum (dashed lines in Fig. 4), where Auger decay is the dominant relaxation process of the core ionised molecules. Some discrepancies are observed between desorption yields and the scaled TEY for both resonances A and B at 23 K and only for resonance B at 75 K. This is discussed in the next section.
In Table 1, we summarise the photo-desorption yields determined in the ionisation continuum (430 eV) and that were used to extrapolate astrophysical desorption yields (Section 5). These values indicate a highly efficient depletion of NH3 in the ice. If we consider that two NH3 molecules are needed for each N2 desorbing, we can estimate that ~0.4 NH3 molecules are lost from the ice per incident photon at 430 eV. The yields in molecules per deposited eV given in Table 2 were determined using Equation (1), and a photo-absorption cross-section of 0.62 Mbarn at 430 eV (Saloman et al. 1988). This calculation takes into account the energy deposited by the photons absorbed within the desorption-relevant depth (see Equations (1) and (2)).
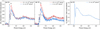 |
Fig. 4 NH3 and N2 desorption yields from ammonia ices at 23 and 75 K, in molecules per incident photon. The TEYs from the lower fluence experiments (≤2 × 10¹⁶ ph cm−2, black dashed curves) are shown in an arbitrary scale to match the NH3 desorption in the ionisation continuum. The colour code is the same as in Fig. 2. |
Desorption yields in molecules per deposited eV at 430 eV, for a photon fluence ≤2 × 10¹⁶ ph cm−2.
4 Discussion
To understand the modulation of the NH3 desorption yields with the photon energy, we need to consider the desorption mechanisms at play. As mentioned, XESD is known to be the main mechanism for molecular ices such as pure methanol and N2/CO. Since XESD is mainly related to the creation and thermalisation of Auger electrons in the ice upon photo-absorption, we expect the desorption to follow the TEY profile. Even if this is generally the case for NH3 desorption, there are clear deviations at the resonances (peaks A and B). This indicates that relaxation processes other than Auger decay occur and also lead to desorption.
For instance, ultra-fast dissociation (UFD), where the excited molecule undergoes fragmentation before Auger decay, has been observed for the first core excited state (peak A) in both gas (Hjelte et al. 2003; Travnikova et al. 2022) and solid ammonia (Menzel et al. 1990; Romberg et al. 2000). However, UFD seems to lead only to enhanced desorption of H+ and not of neutral NH3 (Menzel et al. 1990; Romberg et al. 2000).
Another possibility are processes involving H and H* atoms formed by the dissociation of the final cationic state following the Auger decay of a core-excited molecule. Lyman-α emission has been reported for gas phase NH3 (Coreno et al. 2007; Jakubowska et al. 2007). This emission is relatively more important for the second resonance (peak B) and decreases above the core ionisation energy. In the solid phase, the Lyman-α photons could be absorbed by neighbouring molecules and lead to des-orption. Although the UV photo-desorption and processing of ammonia ices have been studied (Loeffler & Baragiola 2010; Martín-Doménech et al. 2018; Torres-Díaz et al., in prep.), the creation of secondary Lyman-α after X-ray absorption has not yet been reported for the solid phase. On the other hand, if the hydrogen atoms formed in the process have enough kinetic energy, they could lead to desorption by transferring this energy to other molecules, which is known as the kick-out mechanism in the case of VUV photo-desorption from water ices (Dupuy et al. 2021a; Fillion et al. 2022). Hydrogen atoms are mobile even at low temperatures, which allows them to diffuse through the ice and participate in reactions such as recombination with other radicals, which is an exothermic process that has also been proposed to contribute to desorption (Fillion et al. 2022). However, we cannot estimate the relative contribution of these different desorption processes to the yields we report here.
At the first resonance (peak A), the discrepancy with the TEY is only seen at 23 K, which is correlated with the presence of N2 near the surface of the ice, as confirmed by the TPD spectra. If N2 is responsible for the enhanced NH3 desorption, it is not only due to XESD initiated by N2 photo-absorption (which is reflected in the TEY as an increase of the peak’s intensity) but also to other potential mechanisms. For instance, the co-desorption of NH3 with N2, or to desorption induced by the redistribution and transfer of the internal energy of the excited N2 molecules to neighbouring NH3. The N2 trapped in the ice at 75 K is far from the surface, and its presence does not seem to affect significantly NH3 desorption (Fig. 4, panel b). Thus, while an investigation of the details of such processes is beyond the scope of this paper, we suspect some mechanism involving a few ice layers near the surface.
Regarding N2 formation, reaction pathways have been proposed and extensively discussed in the literature (see for instance Parent et al. 2009 and references therein). It has been suggested to require several reaction steps and the formation of precursors such as NH2 radicals and the more stable compound N2H4 (hydrazine). Therefore, a build-up effect is expected for N2 formation related to the accumulation of precursors during irradiation. This explains why the desorption yields are strongly dependent on fluence below 2 × 10¹⁶ ph cm−2: what we probe corresponds to the N2 formation kinetics (and therefore availability to desorb) convoluted with its energy dependant desorption. This highlights the importance of considering the ice’s chemical evolution when discussing desorption yields, as the amount of irradiation received by the ice can affect the determined yield values, especially for irradiation products. Experiments at fixed energy should be performed to better understand N2 formation and desorption kinetics. However, said experiments are time-consuming, and access to synchrotron facilities is limited; an alternative is using electron irradiation experiments, mimicking the effect of the Auger electrons created in the ice upon X-ray absorption. We previously used this approach to study methanol ices (Torres-Díaz et al. 2023) and the corresponding results for ammonia ices will be the subject of a future publication.
5 Astrophysical desorption yields
The desorption yields determined and discussed in the previous sections can be used to calculate average desorption yields in different astrophysical environments by taking into account the local X-ray spectrum and for different H column densities (see Methods section). The astrophysical yields for N2 calculated using the desorption yield measured at 430 eV ranged between 10−2 and 10−4 molecules per incident photon, for H column densities ranging from 1021 to 1024 cm2. However, these values come from the yield obtained for a photo-processed ice (fluence above 2 × 10¹⁶ ph cm−2) , which might not be pertinent in an astrophysical context.
Table 3 presents the average astrophysical desorption yields for NH3 obtained using the experimental desorption yields in the ionisation continuum at 23 K. The NH3 desorption yields were found to be mostly independent of photon fluence, lending us confidence in the extrapolation made here. Average NH3 X-ray photo-desorption yields in disks range from ~10−2 to 10−5 ejected molecules per incident photon, for H column densities ranging from 1021 to 1024 cm2. When compared to X-ray photo-desorption yields of water in a disk, estimated using the same procedure (Dupuy et al. 2018), the yields for NH3 X-ray photo-desorption are four to six times higher than those for H2O at equivalent H column densities. Thus, X-ray induced desorption could strongly affect the gas phase NH3/H2O abundance ratio in disks if it is operative. This finding could help explain the high NH3/H2O ratios or the presence of gas phase NH3 in the midplane of a disk predicted in the study of Salinas et al. (2016). However, this needs to be nuanced since the present yields were obtained from pure NH3 ices and the ice composition is known to change the final desorption yields. All the species present in the ice may be Auger and secondary electron sources during irradiation. Furthermore, reaction pathways could compete with desorption, leading to different desorption yields. Drawing more conclusive results on the different X-ray photo-desorption efficiencies of NH3 and H2O requires the study of X-ray photo-desorption from H2O:NH3 icy mixtures, which are more representative of the detected ice composition in disks.
NH3 X-ray average astrophysical yields in molecules per incident photon at 23 K.
6 Conclusions
We have determined quantitative photo-desorption yields of NH3 and N2 from pure ammonia ices, at 23 and 75 K, in the 395– 435 eV energy range. The NH3 desorption yields are generally independent of ice temperature and morphology. Comparison with the ice absorption reveals that the mechanism is mostly dominated by the XESD process, although an additional contribution has been observed at the resonant core-excited features at 401.2 and 402.9 eV. While NH3 photo-desorption yields are mostly independent of the irradiation fluence, N2 desorption is strongly fluence-dependent, as expected for a product of complex photo-chemical processing of the ice. Fixed energy experiments are needed to understand better the fluence dependency of the N2 desorption yields and, thus, be able to more confidently reach photo-desorption yields in the low fluence regime, fundamental for an extrapolation to the astrophysical conditions.
We also determined average astrophysical desorption yields for NH3 by extrapolating the desorption yields in the ionisation continuum up to 10 keV and considering the X-ray spectrum of TW Hya and several attenuation conditions. These yields range from ~ 10−2 to 10−5 molecules ejected per incident photon, depending on the considered H column density. These values are four to six times higher than H2O X-ray photo-desorption yields from water ices derived previously with the same method. This suggests a strong differential effect for the X-ray photo-desorption between these two species that might explain high NH3/H2O gas phase abundance ratios in the disk around TW Hya. However, this ought to be confirmed by future studies on more realistic mixed H2O:NH3 ices.
Acknowledgements
This work was supported by the ANR PIXyES project, grant ANR-20-CE30-0018 of the French Agence Nationale de la Recherche. We acknowledge SOLEIL for providing synchrotron radiation facilities under Project No. 20210142 and N. Jaouen, H. Popescu, and R. Gaudemer for their help on the SEXTANTS beam line. We also thank the support of the Fédération de Chimie-Physique de Paris Saclay (CPPS), funding by the région Ile-de-France DIM-ACAV+ program, and by the Programme National “Physique et Chimie du Milieu Interstellaire” (PCMI) of CNRS/INSU with INC/INP co-funded by CEA and CNRS.
References
- Basalgète, R., Dupuy, R., Féraud, G., et al. 2021a, A&A, 647, A35 [NASA ADS] [CrossRef] [EDP Sciences] [Google Scholar]
- Basalgète, R., Dupuy, R., Féraud, G., et al. 2021b, A&A, 647, A36 [EDP Sciences] [Google Scholar]
- Basalgète, R., Torres-Díaz, D., Lafosse, A., et al. 2022, J. Chem. Phys., 157, 084308 [CrossRef] [Google Scholar]
- Basalgète, R., Torres-Diaz, D., Lafosse, A., et al. 2023, A&A, 676, A13 [NASA ADS] [CrossRef] [EDP Sciences] [Google Scholar]
- Bethell, T. J., & Bergin, E. A. 2011, ApJ, 740, 7 [NASA ADS] [CrossRef] [Google Scholar]
- Boogert, A. A., Gerakines, P. A., & Whittet, D. C. 2015, ARA&A, 53, 541 [NASA ADS] [CrossRef] [Google Scholar]
- Brown, M. E., & Calvin, W. M. 2000, Science, 287, 107 [NASA ADS] [CrossRef] [Google Scholar]
- Brumbach, S., & Kaminsky, M. 1976, J. Nucl. Mater., 63, 188 [NASA ADS] [CrossRef] [Google Scholar]
- Chen, C. T., Ma, Y., & Sette, F. 1989, Phys. Rev. A, 40, 6737 [NASA ADS] [CrossRef] [Google Scholar]
- Chen, Y.-J., Ciaravella, A., Muñoz Caro, G. M., et al. 2013, ApJ, 778, 162 [NASA ADS] [CrossRef] [Google Scholar]
- Ciaravella, A., Muñoz Caro, G. M., Jiménez-Escobar, A., et al. 2020, Proc. Natl. Acad. Sci., 117, 16149 [CrossRef] [Google Scholar]
- Cleeves, L. I., Bergin, E. A., Qi, C., Adams, F. C., & Öberg, K. I. 2015, ApJ, 799, 204 [CrossRef] [Google Scholar]
- Cochran, A. L., & Cochran, W. D. 1981, Icarus, 48, 488 [NASA ADS] [CrossRef] [Google Scholar]
- Collings, M. P., Anderson, M. A., Chen, R., et al. 2004, MNRAS, 354, 1133 [NASA ADS] [CrossRef] [Google Scholar]
- Coreno, M., Kivimäki, A., Simone, M. d., et al. 2007, Phys. Scr., 76, C90 [CrossRef] [Google Scholar]
- Drozdovskaya, M. N., Bockelée-Morvan, D., Crovisier, J., et al. 2023, A&A, 677, A157 [NASA ADS] [CrossRef] [EDP Sciences] [Google Scholar]
- Dupuy, R., Bertin, M., Féraud, G., et al. 2018, Nat. Astron., 2, 796 [CrossRef] [Google Scholar]
- Dupuy, R., Féraud, G., Bertin, M., et al. 2020, J. Chem. Phys., 152, 054711 [NASA ADS] [CrossRef] [Google Scholar]
- Dupuy, R., Bertin, M., Féraud, G., et al. 2021a, Phys. Rev. Lett., 126, 156001 [NASA ADS] [CrossRef] [Google Scholar]
- Dupuy, R., Bertin, M., Féraud, G., et al. 2021b, Phys. Chem. Chem. Phys., 23, 15965 [NASA ADS] [CrossRef] [Google Scholar]
- Emery, J. P., Burr, D. M., Cruikshank, D. P., Brown, R. H., & Dalton, J. B. 2005, A&A, 435, 353 [NASA ADS] [CrossRef] [EDP Sciences] [Google Scholar]
- Feulner, P., Scheuerer, R., Scheuer, M., et al. 1992, Appl. Phys. A Solids Surf., 55, 478 [CrossRef] [Google Scholar]
- Fillion, J.-H., Dupuy, R., Féraud, G., et al. 2022, ACS Earth Space Chem., 6, 100 [NASA ADS] [CrossRef] [Google Scholar]
- Gerakines, P. A., Schutte, W. A., & Ehrenfreund, P. 1996, A&A, 312, 289 [NASA ADS] [Google Scholar]
- Hitchcock, A. P. 1990, Phys. Scr., T31, 159 [Google Scholar]
- Hjelte, I., Piancastelli, M., Jansson, C., et al. 2003, Chem. Phys. Lett., 370, 781 [NASA ADS] [CrossRef] [Google Scholar]
- Hofstadter, M. D., & Muhleman, D. O. 1989, Icarus, 81, 396 [NASA ADS] [CrossRef] [Google Scholar]
- Jaeger, R., Stöhr, J., & Kendelewicz, T. 1983, Surf. Sci., 134, 547 [CrossRef] [Google Scholar]
- Jakubowska, K., Vall-llosera, G., Kivimäki, A., et al. 2007, J. Phys. B Atom. Mol. Opt. Phys., 40, 1489 [NASA ADS] [CrossRef] [Google Scholar]
- Jiménez-Escobar, A., Ciaravella, A., Cecchi-Pestellini, C., et al. 2018, ApJ, 868, 73 [Google Scholar]
- Jiménez-Escobar, A., Ciaravella, A., Cecchi-Pestellini, C., et al. 2022, ApJ, 926, 176 [NASA ADS] [CrossRef] [Google Scholar]
- Lindblad, A., Bergersen, H., Pokapanich, W., et al. 2009, Phys. Chem. Chem. Phys., 11, 1758 [CrossRef] [Google Scholar]
- Loeffler, M. J., & Baragiola, R. A. 2010, J. Chem. Phys., 133, 214506 [NASA ADS] [CrossRef] [Google Scholar]
- Martín-Doménech, R., Cruz-Díaz, G. A., & Muñoz Caro, G. M. 2018, MNRAS, 473, 2575 [CrossRef] [Google Scholar]
- McClure, M. K., Rocha, W. R. M., Pontoppidan, K. M., et al. 2023, Nat. Astron., 7, 431 [NASA ADS] [CrossRef] [Google Scholar]
- Menzel, D., Rocker, G., Coulman, D., Feulner, P., & Wurth, W. 1990, Phys. Scr., 41, 588 [CrossRef] [Google Scholar]
- Najita, J. R., Carr, J. S., Brittain, S. D., et al. 2021, ApJ, 908, 171 [CrossRef] [Google Scholar]
- Nomura, H., Aikawa, Y., Tsujimoto, M., Nakagawa, Y., & Millar, T. J. 2007, ApJ, 661, 334 [NASA ADS] [CrossRef] [Google Scholar]
- Notsu, S., Van Dishoeck, E. F., Walsh, C., Bosman, A. D., & Nomura, H. 2021, A&A, 650, A180. [NASA ADS] [CrossRef] [EDP Sciences] [Google Scholar]
- Öberg, K. I., Boogert, A. C. A., Pontoppidan, K. M., et al. 2011, ApJ, 740, 109 [Google Scholar]
- Parent, P., Bournel, F., Lasne, J., et al. 2009, J. Chem. Phys., 131, 154308 [NASA ADS] [CrossRef] [Google Scholar]
- Pontoppidan, K. M., Salyk, C., Banzatti, A., et al. 2019, ApJ, 874, 92 [NASA ADS] [CrossRef] [Google Scholar]
- Romberg, R., Frigo, S., Ogurtsov, A., Feulner, P., & Menzel, D. 2000, Surf. Sci., 451, 116 [NASA ADS] [CrossRef] [Google Scholar]
- Salinas, V. N., Hogerheijde, M. R., Bergin, E. A., et al. 2016, A&A, 591, A122 [NASA ADS] [CrossRef] [EDP Sciences] [Google Scholar]
- Saloman, E., Hubbell, J., & Scofield, J. 1988, Atom. Data Nucl. Data Tables, 38, 1 [NASA ADS] [CrossRef] [Google Scholar]
- Satorre, M., Leliwa-Kopystynski, J., Santonja, C., & Luna, R. 2013, Icarus, 225, 703 [NASA ADS] [CrossRef] [Google Scholar]
- Schirmer, J., Trofimov, A. B., Randall, K. J., et al. 1993, Phys. Rev. A, 47, 1136 [NASA ADS] [CrossRef] [Google Scholar]
- Sette, F., Stöhr, J., & Hitchcock, A. P. 1984, J. Chem. Phys., 81, 4906 [NASA ADS] [CrossRef] [Google Scholar]
- Smith, R. S., Huang, C., Wong, E. K. L., & Kay, B. D. 1997, Phys. Rev. Lett., 79, 909 [NASA ADS] [CrossRef] [Google Scholar]
- Smith, R. S., May, R. A., & Kay, B. D. 2016, J. Phys. Chem. B, 120, 1979 [Google Scholar]
- Stöhr, J. 1992, Springer Series in Surface Sciences, NEXAFS Spectroscopy (Berlin, Heidelberg: Springer Berlin Heidelberg), 25 [Google Scholar]
- Sturm, J. A., McClure, M. K., Beck, T. L., et al. 2023, A&A, 679, A138 [NASA ADS] [CrossRef] [EDP Sciences] [Google Scholar]
- Tîmneanu, N., Caleman, C., Hajdu, J., & van der Spoel, D. 2004, Chem. Phys., 299, 277 [CrossRef] [Google Scholar]
- Torres-Díaz, D., Basalgète, R., Bertin, M., et al. 2023, Chem. Phys. Chem., 24, e202200912 [Google Scholar]
- Travnikova, O., Kukk, E., Hosseini, F., et al. 2022, Phys. Chem. Chem. Phys., 24, 5842 [NASA ADS] [CrossRef] [Google Scholar]
- Wyckoff, S., Tegler, S. C., & Engel, L. 1991, ApJ, 367, 641 [NASA ADS] [CrossRef] [Google Scholar]
- Zheng, W., Jewitt, D., Osamura, Y., & Kaiser, R. I. 2008, ApJ, 674, 1242 [NASA ADS] [CrossRef] [Google Scholar]
This can be understood as a type of desorption induced by electronic transitions (DIET). It has also been referred to as ‘DIET by secondary electrons’ (Feulner et al. 1992) and ‘ESD via secondary electrons’ (Jaeger et al. 1983) in the literature.
All Tables
Desorption yields in molecules per deposited eV at 430 eV, for a photon fluence ≤2 × 10¹⁶ ph cm−2.
All Figures
|
Fig. 1 TEY from pristine ammonia ices, deposited and measured at the indicated temperature (23 or 75 K). Features A and B are attributed to electronic transitions (see text). The N 1s binding energy (Eb = 403.6 eV) determined for ammonia clusters is taken from Lindblad et al. (2009). The photon flux is ~2 × 10¹¹ ph s−1, fluence is 0–1 × 10¹⁵ ph cm−2. |
| In the text | |
|
Fig. 2 TEY from ammonia ices over different fluence ranges, at 23 (a) and 75 K (b). The inlets in panels a and b show the TEY below 400 eV. Panel c shows a zoom-in of the ammonia TEY around 401 eV (at 75 K) compared to the partial electron yield (PEY) from a pure N2 ice from Feulner et al. (1992), in arbitrary units. N2 formation during irradiation of ammonia ices is confirmed by the appearance of the N2 vibronic structure (green trace, spectral resolution of 20 meV). The legend gives the initial and final fluences for each energy scan. The photon flux is ~2 × 10¹¹ ph s−1 for the black and green traces and ~2 × 10¹² ph s−1 for the others. |
| In the text | |
|
Fig. 3 Post-irradiation TPD. The legend gives the temperature at which the ice was deposited and kept during irradiation. Mass fragments 17 and 28 were used to follow the thermal desorption of NH3 and N2, respectively. Total fluence received by the ices ~4 × 10¹⁶ ph cm−2. Heating rate 12 K min−1. |
| In the text | |
|
Fig. 4 NH3 and N2 desorption yields from ammonia ices at 23 and 75 K, in molecules per incident photon. The TEYs from the lower fluence experiments (≤2 × 10¹⁶ ph cm−2, black dashed curves) are shown in an arbitrary scale to match the NH3 desorption in the ionisation continuum. The colour code is the same as in Fig. 2. |
| In the text | |
Current usage metrics show cumulative count of Article Views (full-text article views including HTML views, PDF and ePub downloads, according to the available data) and Abstracts Views on Vision4Press platform.
Data correspond to usage on the plateform after 2015. The current usage metrics is available 48-96 hours after online publication and is updated daily on week days.
Initial download of the metrics may take a while.