| Issue |
A&A
Volume 676, August 2023
|
|
|---|---|---|
| Article Number | A13 | |
| Number of page(s) | 12 | |
| Section | Atomic, molecular, and nuclear data | |
| DOI | https://doi.org/10.1051/0004-6361/202346209 | |
| Published online | 27 July 2023 | |
X-ray photodesorption of complex organic molecules in protoplanetary disks
I. Acetonitrile CH3CN
1
Sorbonne Université, Observatoire de Paris, Université PSL, CNRS, LERMA,
75005
Paris, France
e-mail: This email address is being protected from spambots. You need JavaScript enabled to view it.
2
Université Paris-Saclay, CNRS, ISMO,
91405
Orsay, France
Received:
21
February
2023
Accepted:
8
June
2023
Abstract
Context. X-rays emitted from pre-main-sequence stars at the center of protoplanetary disks can induce nonthermal desorption from interstellar ices populating the cold regions of the disk. This process, known as X-ray photodesorption, needs to be quantified for complex organic molecules (COMs), including acetonitrile CH3CN, which has been detected in several disks.
Aims. The purpose of this work is to experimentally estimate the X-ray photodesorption yields of neutral species from pure CH3CN ices and from interstellar ice analogs for which CH3CN is mixed either in a CO-dominated ice or in a H2O-dominated ice.
Methods. The ices, grown in an ultrahigh vacuum chamber, were irradiated at 15 K by soft X-rays from synchrotron light (SOLEIL synchrotron) in the N K edge region (395–420 eV) and in the O K edge region (530–555 eV). X-ray photodesorption was probed in the gas phase via quadrupole mass spectrometry by monitoring the changes in the mass signals due to the X-ray irradiation of the ices. X-ray photodesorption yields were derived from the mass signals and were extrapolated to higher X-ray energies in order to provide astrophysical yields adapted to astrochemical models.
Results. X-ray photodesorption of the intact CH3CN is detected from pure CH3CN ices and from mixed 13CO:CH3CN ices, with an experimental yield of about 5 × 10⁻⁴ molecules photon−1 at 560 eV. When mixed in H2O-dominated ices, X-ray photodesorption of the intact CH3CN at 560 eV is below its detection limit, which is 10−4 molecules photon−1. Yields associated with the desorption of HCN, CH4, and CH3 are also provided. The derived astrophysical yields significantly depend on the local conditions expected in protoplanetary disks, that is, on the ice composition and on the local X-ray irradiation spectrum. They vary from ~10−4 to ~10−6 molecules photon−1 for the X-ray photodesorption of intact CH3CN from CO-dominated ices. Only upper limits varying from ~5 × 10⁻⁵ to ~5 × 10⁻⁷ molecules photon−1 could be derived for the X-ray photodesorption of intact CH3CN from H2O-dominated ices.
Conclusions. X-ray photodesorption of intact CH3CN from interstellar ices might in part explain the abundances of CH3CN observed in protoplanetary disks. The desorption efficiency is expected to vary with the local physical conditions, hence with the disk region considered.
Key words: astrochemistry / radiation mechanisms: non-thermal
© The Authors 2023
 Open Access article, published by EDP Sciences, under the terms of the Creative Commons Attribution License (https://creativecommons.org/licenses/by/4.0), which permits unrestricted use, distribution, and reproduction in any medium, provided the original work is properly cited.
This article is published in open access under the Subscribe to Open model. This email address is being protected from spambots. You need JavaScript enabled to view it. to support open access publication.
1 Introduction
The detection of complex organic molecules (COMs) in protoplanetary disks at the very early stages of planet formation raises the question of their role in the emergence of life in nascent planets via prebiotic chemistry. Gaseous acetonitrile CH3CN, one COM, is detected in several disks (Öberg et al. 2015; Bergner et al. 2018; Loomis et al. 2018). Its formation pathways in the interstellar medium (ISM) include both gas-phase reactions and energetic or nonenergetic ice chemistry. However, disk modeling studies that include gas-phase pathways alone fail to reproduce the observed abundances of CH3CN (Öberg et al. 2015; Loomis et al. 2018). Instead, the models suggest an ice formation route and a subsequent delivery of CH3CN to the gas phase via nonthermal desorption processes. In particular, it is deduced from the models that gas-phase CH3CN should be dominantly present in the upper layers of the observed disks (Öberg et al. 2015; Loomis et al. 2018), where photons emitted from the pre-main-sequence (PMS) star irradiate the ices.
It is therefore expected that photon-induced desorption, known as photodesorption, should play an important role in explaining gas-phase CH3CN in disks. As mentioned in Öberg et al. (2015) and Loomis et al. (2018), these photodesorption processes are poorly constrained experimentally.
Recently, vacuum ultraviolet (VUV) photodesorption in the 7–13.6 eV range of intact CH3CN from interstellar ice analogs has been experimentally demonstrated (Basalgète et al. 2021c). However, the derived photodesorption yields (~10−5 molecules photon−1) are two orders of magnitude lower than the yield that was used to explain the column density of the observed CH3CN by disk modeling (Loomis et al. 2018). This may indicate that nonthermal desorption processes other than VUV photodesorption could be at play in protoplanetary disks. For instance, PMS stars can be strong X-ray emitters (Güdel & Nazé 2009; Testa 2010; Feigelson 2010), and laboratory astrophysics experiments conducted in recent years have shown that X-rays can induce desorption from interstellar ice analogs (Dupuy et al. 2018, 2021; Jiménez-Escobar et al. 2018; Ciaravella et al. 2020; Basalgète et al. 202la,b. Additionally, in a recent modeling study of Notsu et al. (2021), it has been shown that X-ray photodesorption can have a significant influence on the gas-phase abundances of water outside the water snowlines of disks. This further encourages additional experimental studies of X-ray photodesorption from interstellar ices.
In this study, we experimentally quantify X-ray photodes-orption of neutral species from CH3CN-containing ices. X-ray photodesorption is studied as a function of the ice composition, first from pure ices of acetonitrile, and then from interstellar ice analogs for which CH3CN is mixed in CO-dominated or H2O-dominated ices. These mixed ices serve as model ices representing different cold regions of protoplanetary disks, namely the regions outside the H2O or the CO snowlines where the surface of the ice is expected to be mainly composed of H2O or CO, respectively, but can also contain small quantities of CH3CN. We restrict the studies to ices irradiated at 15 K for different mixtures in order to understand the effect of the ice composition alone, without the effect of the ice temperature, which varies with the disk region that is considered. The studies are conducted in the soft X-ray range, on the SEXTANTS beam line of the SOLEIL synchrotron facility. Two energy ranges were selected: (1) the 395–420 eV range, referred to as the N K edge region, where the photoabsorption is dominated by N-bearing species, that is, CH3CN, and (2) the 525–560 eV range, referred to as the O K edge region, where the photoabsorption is dominated by O-bearing species, that is, H2O or CO. Consequently, selective photoexcitation of CH3CN, H2O, or CO enables us to study possible indirect desorption mechanisms that have been highlighted in previous studies (Basalgète et al. 2022). X-ray photodesorption yields extrapolated to the 0.4–10 keV range and averaged over different attenuated X-ray emission spectra of PMS stars, referred to as astrophysical yields, were derived in order to facilitate the implementation of X-ray photodesorption in astrochemical models. Section 2 describes the experimental procedure and the derivation of the yields. In Sect. 3, we present the results, and their astrophysical implications are discussed in Sect. 4. This is paper I of an experimental work dedicated to the study of the X-ray photodesorption of COMs from interstellar ice analogs. Paper II studies the X-ray photodesorption of formic acid HCOOH.
2 Experimental procedure
2.1 Ice deposition, TEY, and synchrotron beam line
Experiments were conducted using the surface processes and ices (SPICES) setup. It consists of an ultrahigh vacuum chamber (UHV) with a base pressure of ~10−10 Torr, equipped with a quadrupole mass spectrometer (QMS). At the center of the chamber, a rotatable copper substrate (polycrystalline oxygen-free high-conductivity copper) is mounted on a sample holder that can be cooled down to 15 K by a closed-cycle helium cryostat. The ices are formed on the substrate by injecting gas-phase molecules in the chamber via a tube that can be positioned a few millimeters in front of the substrate surface. Different injection gas lines enable us to deposit binary mixed ices, with dilution ratios that are controlled by adjusting the partial pressure associated with each species during deposition. Isotopologs are used to facilitate the analysis of the mass spectrometer data. Pure acetonitrile  (99% purity, Sigma-Aldrich) and
 (99% isotopic purity, Sigma-Aldrich) ices were deposited and irradiated at 15 K. Mixed 13CO:CH3CN ices (13CO from 99% 13C purity Eurisotop) were deposited and irradiated at 15 K. Mixed H2O:CH3CN ices (H2O from liquid chromatography standard Fluka) were deposited at 90 K, cooled down to 15 K and irradiated at 15 K. This ensured that the resulting water ice is in its compact amorphous phase, referred to as compact amorphous solid water (c-ASW). The thickness of the grown ices is expressed in monolayers (ML), equivalent to a surface density of ~1015 molecules cm−2. Temperature-programmed desorption (TPD) experiments conducted prior to the presented studies enabled us to control the number of ML deposited with a precision of about 10% (see, e.g., Bertin et al. 2017 for TPD of acetonitrile).
The substrate was electrically insulated from the sample holder by a Kapton foil. This enabled the measurement of the drain current generated by the escape of electrons from the ice into the vacuum after X-ray absorption. From this current, we derived the total electron yield (TEY), expressed in electrons per incident photon (e− photon−1 for more simplicity), and measured as a function of the incident photon energy. The TEY is sensitive to the changes in the molecular composition near the ice surface with the ongoing irradiation, that is, with the photon fluence (expressed in photons cm−2), and it can be assimilated to the X-ray absorption spectrum of the studied ices. The ice depth probed by the TEY measurements is estimated to be a few tens of ML based on studies of water ice (Tîmneanu et al. 2004) and of CO/N2 ices (Basalgète et al. 2022).
X-rays from the SEXTANTS beam line of the SOLEIL synchrotron facility at Saint-Aubin, France (Sacchi et al. 2013), were routed to the UHV chamber to irradiate the grown ices. Photons in the N and O K edge regions (395–420 eV and 525–560 eV, respectively) were used with different spectral width (namely 1.2 eV or 90 meV) and with a flux varying from 1012 to 1013 photons s−1, the latter was measured by a calibrated silicon photodiode mounted on the beam line. The beam was sent at a 47° incidence relative to the normal of the substrate surface, and the spot area at the surface was ~0.1 cm2. The calibration of the energy scale was performed similarly to what is described in Basalgète et al. (2022). Namely, in the N K edge region, a TEY was measured on a pure N2 ice at 15 K, and the TEY feature corresponding to the N 1s → π*(υ′ = 0) transition of N2 was set to 400.868 eV according to Chen et al. (1989). In the O K edge region, a TEY was measured on a pure CO ice at 15 K, and the TEY feature corresponding to the O 1s → π* transition of CO was centered at 534.4 eV according to Jugnet et al. (1984).
2.2 Derivation of the X-rayphotodesorption yields
The X-ray photodesorption of neutral species was monitored in the gas phase of the UHV chamber during the X-ray irradiation of the ices and by means of the QMS equipped with an electron-impact (at 70 eV) ionization stage. The desorption intensities I(E) associated with a desorbing neutral species X for a photon energy E were derived by following the m/z signals of the QMS during the X-ray irradiation. Irradiation at fixed energy for a few tens of seconds results in a sudden increase and decrease in the mass signals that is associated with X-ray photodesorption. IX(E) was then computed as the height of the signal increase in that case. Examples of these QMS signals are presented in Fig. A.1 for the mass signals m/z 27 from a pure ice and m/z 41 from a mixed 13CO:C3CN (10:1) ice. The QMS signals can also be monitored by continuously scanning the incident photon energy, resulting in signals similar to what is displayed in Fig. A.2. In this case, the timescale was converted into an energy scale and the background level (mass signal without irradiation) was subtracted to derive IX(E). After the attribution of the m/z channels to desorbing neutral species (see Sects. 3.2 and 3.3), the intensities IX(E) were corrected for the fragmentation of these attributed species due to their ionization by electron impact. The fragmentation patterns were taken from the NIST database (Linstrom & Mallard 2022). The resulting intensities were then converted into X-ray photodesorption yields ΓX(E), expressed in molecules desorbed per incident photon (simplified to molecules photon−1 in this study), using Eq. (1),
 (1)
(1)
where ϕ(Ε) is the photon flux at E, and kX is a conversion factor associated with the neutral species X. The coefficient kX was calibrated on N2.  relates the QMS current to a calibrated number of N2 molecules desorbed during TPD experiments (see Basalgète et al. 2022 for more details of the calibration procedure). The factor kX associated with other neutral species was derived from
  by taking into account (i) the relative differences in the electron-impact ionization cross sections between N2 and the species X and (ii) the differences in the QMS apparatus function between m/z(N2) and m/z(X). Electron-impact ionization cross sections were taken from the literature for CH3CN (Zhou et al. 2019), HCN (Pandya et al. 2012), CH4 (Tian & Vidal 1998) and CH3 (Tarnovsky et al. 1996).
2.3 Extrapolation to higher energies. Astrophysical yields
X-ray photodesorption yields were derived in the soft X-ray range (<600 eV), whereas X-rays emitted from PMS stars at the center of protoplanetary disks range from 0.1 to 10 keV. We then derived the X-ray photodesorption yields Γastro for mixed ices averaged in the 0.4–10 keV range by (i) extrapolating the experimental yields ΓX up to 10 keV and (ii) considering the X-ray emission spectrum ϕlocal of a typical T Tauri star (from Nomura et al. 2007), which we attenuated by using the photoelectric cross section of gas and dust in a typical T Tauri protoplanetary disk (from Bethell & Bergin 2011). This resulted in the following formula:
 (2)
(2)
The attenuated X-ray emission spectra depend on the column density of gas and dust traversed by X-rays and are displayed in Fig. B.1. The experimental yields ΓX were extrapolated up to 10 keV by assuming that (i) the X-ray photodesorption yields follow the X-ray absorption profile of the ices, as shown in Sect. 3 for the N and O K edge regions, and (ii) the X-ray absorption of the ices above 560 eV follows the gas-phase core O 1s ionization cross section, which is similar for H2O and CO and was taken from Berkowitz (2002). Examples of extrapolated yields are given in Fig. B.2. We assumed that the X-ray photodesorption yields per absorbed photon do not depend on the photon energy, as suggested in Dupuy et al. (2018) and Jiménez-Escobar et al. (2018). The values of the yields in units of absorbed photons are also provided in Sect. 4 based on a similar method as in Basalgète et al. (2022), assuming that up to 30 ML of the ice contribute to the desorption, and without taking the dilution of CH3CN into account. These yields can easily be extrapolated to environments other than protoplanetary disks.
3 Results
3.1 TEYs with photon fluence
The TEYs measured on the studied ices are displayed in Fig. 1 for the 395–420 eV range. Their evolution with the photon fluence, expressed in photons cm−2, is also shown. Our TEYs of the pure CH3CN ice compare well with that of Parent et al. (2000). In this energy range, the X-ray photoabsorption is dominated by N-bearing species. As discussed in the experimental section, the ice depth probed by a TEY measurement is estimated to be a few tens of ML. The evolution of the TEY features with the photon fluence therefore provides information on the changes in the molecular composition near the ice surface, where "near the ice surface" refers to the first tens of ML of the ice.
We first focus on the TEY feature near 400 eV, which dominates the TEYs for low photon fluences and for each studied ice. It is associated with the N 1s → π* core transition of CH3CN in the solid phase. Its intensity decreases with the photon fluence due to the photodissociation of CH3CN. In the case of the pure CH3CN ice and the mixed 13CO:CH3CN (1 :1) ice (see the left panels of Fig. 1), this feature still dominates the TEY for a high photon fluence (~8−10 × 1016 photons cm−2), meaning that CH3CN is still present near the ice surface in a significant amount for such fluences. In the case of the mixed H2O:CH3CN ices (1:1 and 10:1), the behavior of the CH3CN feature is very different, as shown in the right panels of Fig. 1. Its decrease with the photon fluence is much faster than for the other studied ices, and it almost totally disappears for a photon fluence ~8 × 10¹⁶ photons cm−2. This indicates that the water ice provides reactive species, for instance, the OH radical, that increases the destruction kinetics of CH3CN in the case of the H2O:CH3CN ices compared to the case of the pure CH3CN and the 13CO:CH3CN ices. This kinetic difference in the consumption of CH3CN has also been observed when irradiating pure CH3CN and mixed H2O:CH3CN ices with UV photons (with a broadband 7–10.2 eV hydrogen lamp) at 20 K in the study of Bulak et al. (2021). This behavior does not depend on the photon energy in our experiments because the TEYs displayed in Fig. 1 were measured for ices that were irradiated both near the N and the O K edges. This is consistent with the fact that the chemistry is dominated by the secondary low-energy electrons created after X-ray absorption and does not depend on the primary photoexcitation or ionization.
Among the possible species that formed during the X-ray irradiation, a new feature that appeared with the photon fluence near 401 eV suggests the accumulation of N2 near the ice surface for each studied ice (at 15 K). This feature can be associated with the N 1s → π* core transition of N2, as seen from TEY measurements of pure N2 ices (Basalgète et al. 2022) and similar to K-shell photoabsorption studies of gas-phase N2 (Chen et al. 1989). The absence of this feature in the TEY of the pure CH3CN ice irradiated at 90 K supports its attribution to N2 formation, as N2 would thermally desorbs at this temperature. In the inset of the bottom right panel of Fig. 1, the red curve clearly and definitively confirms this attribution. When the spectral resolution is high enough (in this case, 90 meV), the vibrational structure of the N (1s)−1π* state of N2 is resolved in the TEY, similarly to what has been observed for pure N2 ice in Basalgète et al. (2022). Possible N2 contamination from the UHV chamber or from the X-ray beam line that would deposit at the ice surface and significantly contribute to the measured TEY seems unlikely because the base pressure was kept at 10−10 Torr during the experiments, excluding significant deposition of contaminants on the ice surface on the experimental timescale. Any possible N2 contamination of the sample was searched for and ruled out, for example, via performing TEY measurements on fresh ices at the N-K edge of N2, and on the bare copper substrate at low temperature. The solid N2 TEY signal was found to be directly correlated to the photon irradiation (it depends on the fluence and photon energy) and also to the amount of condensed acetonitrile deposited for a given fluence condition. This gives us confidence that N2 is indeed photoproduced from the solid CH3CN during irradiation. Surprisingly, N2 is formed upon X-ray irradiation regardless of the ice composition. However, further investigations are needed to assess how its formation pathways and its formation kinetics depend on the ice composition. For the mixed ices, where CH3CN molecules are less likely to be spatially close to each other in the ice, the diffusion of N-bearing radicals and/or the formation of CH3CN clusters or islands during the ice deposition might partly explain the formation of N2. For instance, Jimenez-Escobar et al. (2022) highlighted that the irradiation of interstellar ices by X-rays can induce the diffusion of species through hundreds of ML.
Any photoproducts other than N2 that are formed during the X-ray irradiation of each studied ice do not participate significantly in the photoabsorption in the 395–420 eV range because no significant new features other than that of N2 appear in the TEY with the photon fluence. It is clear, however, that we do not have the full picture of the X-ray induced chemistry in the TEY measurements. In the literature, low-energy electron irradiation of pure acetonitrile ices (Ipolyi et al. 2007; Bass et al. 2012) suggests the formation of HCN and C2H6. Abdoul-Carime et al. (2022) suggested the formation of CH3OH (detected by TPD) in mixed H2O:CH3CN ice irradiated by low-energy electrons. As the CH3OH absorption features overlap with that of H2O in the TEYs near the O K edge, we cannot discuss its formation with our data set. In VUV irradiation experiments of H2O:CH3CN ices, the formation of larger COMs was reported (Bulak et al. 2021) even though VUV and X-ray photochemistry are not necessarily comparable.
The TEYs measured near the O K edge for mixed 13CO:CH3CN and H2O:CH3CN ices are displayed in Fig. C.1. The observed features are similar to the feature corresponding to pure H2O and pure CO ice that was studied in Dupuy et al. (2020, 2021). The main feature for the 13CO:CH3CN ice is associated with the O 1s → π* transition of 13CO near 534.4 eV. The features associated with H2O are discussed in more detail in Dupuy et al. (2020). Significant modifications of these TEYs with the photon fluence are not observed, meaning that potential photoproducts that formed during the X-ray irradiation of the mixed ices do not significantly participate in the photoabsorption of the ices in the 530–555 eV range.
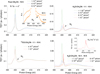 |
Fig. 1 TEYs in the N K edge region of a pure CH3CN ice at 15 K (top left panel; the inset shows the region near the N 1s → π* resonance for an ice irradiated at 15 K and 90 K for the lower and upper curve, respectively; these curves are shifted vertically for more clarity), of a mixed H2O:CH3CN ice irradiated at 15 K with a dilution ratio of 1:1 and 10:1 (top and bottom right panel, respectively), and of a mixed 13CO:CH3CN ice irradiated at 15 K with a dilution ratio of 1:1 (bottom left panel). The photon fluence received by the ice before each TEY measurement is also displayed. The spectral width of the beam was set to 1.2 eV for all the TEY measurements, except for the one corresponding to the red curve in the bottom right panel, for a H2O:CH3CN ice having received a photon fluence of 1×10¹⁷ photons cm−2 and for which the spectral width was 90 meV. The inset in the bottom right panel zooms into the TEY measured on the H2O:CH3CN (10:1) ice for a photon fluence of 1017 photons cm−2, where the vibrational structure of the core hole state of N2 formed near the ice surface can be seen near 401 eV. The ices have a total thickness of ~100 ML. |
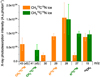 |
Fig. 2 X-ray photodesorption intensities divided by the photon flux (in A s photon−1) at 420 eV of desorbing species from pure acetonitrile ices. The mass channels monitored during the experiments are indicated on the X-axis. The attribution of these mass channels to desorbing neutral species is discussed in the text. The different colors are associated with a natural |


3.2 X-ray photodesorption from pure CH3 CN ice
Pure acetonitrile ices were irradiated at 15 K in the N K edge region (395–420 eV). X-ray photodesorption was detected in several mass channels of the QMS. Isotopologs  and
and  were used to attribute desorbing neutral species to the mass channels. In Fig. 2, we display the variations in the desorption intensities (divided by the photon flux) with the isotopolog for pure acetonitrile ices irradiated at 15 K and at 420 eV in the ionization region of the N 1s electron. At this point, the displayed intensities are not corrected for any possible fragmentation pattern of the desorbing species. The desorption intensities of the m/z 41 and 43 from pure
  and
and  ices, respectively, are similar. This confirms the X-ray photodesorption of the intact acetonitrile molecule from the studied ices. The desorption intensity of the m/z 15 does not change significantly from one isotopolog to the next, indicating the X-ray photodesorption of the methyl group CH3. The possible desorption of CH4 that would contribute to the m/z 15 signal due to its fragmentation at the QMS entrance can be excluded because no desorption signal on the m/z 16 was detected at 420 eV for either isotopolog. Irradiation of pure acetonitrile ices at 12 K by UV photons and 0.8 MeV protons has revealed the formation of CH4 in Hudson & Moore (2004), however.
For the  ice, the desorption intensity of the m/z 29 is ~9.0 × 10⁻²⁵ A s photon−1. A similar level of signal is observed on the m/z 27 for the
  ice. This indicates the X-ray photodesorption of HCN from the pure acetonitrile ices, explaining the signals on the m/z 29 (H13C15N) for the
  ice and on the m/z 27 (H12C14N) for the
  ice. HCN formation has previously been suggested (by post-irradiation TPD experiments) in low-energy electron irradiation experiments of pure CH3CN ice at 35 K (Ipolyi et al. 2007). Additionally, low-energy electron-stimulated desorption of
  from pure CH3CN ice at 30 K observed in the study of Bass et al. (2012) led the authors to suggest the formation of HCN after the dissociative electron attachment (DEA) of CH3CN into
  and CN followed by H migration to CN. In our experiments, the X-ray induced chemistry is dominated by the cascade of low-energy secondary electrons after X-ray absorption. It is therefore expected that HCN formation as observed by Ipolyi et al. (2007) and Bass et al. (2012) and subsequent photodesorption can occur.
The attribution of the m/z 30 and 28 is not clear due to the large error bars on the m/z 28 and the fact that the m/z 30 was not recorded for the  ice. This complicates the interpretation of these signals. Additionally, several molecules can contribute to these two mass channels. The m/z 30 observed from the
  ice could correspond to C2H6 and/or 15N2 desorption. The desorption of C2H6 is supported by the studies of Ipolyi et al. (2007) and Bass et al. (2012), where its formation was suggested to occur via reaction between CH3 radicals after DEA of CH3CN into CN− and CH3. The desorption of N2, which would contribute to the m/z 30 for the
  ice and to the m/z 28 for the
  ice, is supported by its formation near the ice surface, as seen in our TEY data (see Fig. 1). As stated in Sect. 3.1, blank experiments on fresh ices or on the bare copper substrate allowed us to rule out any possible N2 contamination from the experimental setup or the beam line. We therefore associate any N2 detection with its X-ray induced formation and subsequent desorption from the ice. The fragmentation of desorbing C2H6 at the QMS entrance could also contribute to the m/z 28 observed for both isotopologs. The m/z 28 observed from the
  ice could also have a contribution from desorbing 13C15N after DEA of
  , supported by the anion desorption of
  observed by Bass et al. (2012). Finally, the entanglement is such that we cannot conclude about the attribution of the m/z 28 and 30 from the pure ices.
After conversion of the desorption intensities to desorption yields, we display in Table 1 the X-ray photodesorption yields at 420 eV of the identified species (CH3CN, HCN, and CH3) from our experiments on pure acetonitrile ices. The displayed yields are taken as the average on the two isotopologs. We did not correct the HCN yield for the fragmentation of potentially desorbing C2 H6, which means that this yield might be overestimated (by ~30% when we consider that the full intensity measured on the m/z 30 corresponds to C2H6 desorption). The pure acetonitrile ices were also irradiated by varying the photon energy from 395 eV to 420 eV either at fixed energies or by continuously scanning the photon energy. X-ray photodesorption yields were then derived as a function of the photon energy. The resulting photodesorption spectra are shown in Fig. 3 for the desorption of  and H12C14N from a pure
  ice irradiated at 15 K. The spectra display the same energy dependence as the TEYs, with a dominant contribution at 400 eV, corresponding to the N 1s → π* resonance of CH3CN. This confirms that the X-ray photodesorption is well correlated to the X-ray photoabsorption of the ice.
X-ray photodesorption yields in molecules desorbed per incident photon (molecules photon−1) of CH3CN, HCN, and CH3 from pure CH3CN ices irradiated at 15 K and at a photon energy of 420 eV.
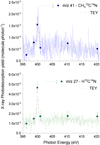 |
Fig. 3 X-ray photodesorption yields of |


3.3 X-ray photodesorption from mixed ices
X-ray irradiation experiments at 15 K in the N and O K edge regions were conducted when CH3CN was mixed in 13CO or H2O ices with different dilution factors (with a total ice thickness of ~100 ML). In these experiments, the acetonitrile isotopolog we used was the natural one (12CH312C14N). Tuning the photon energy to the N K edge region results in the dominant photoexcitation of CH3CN, whereas tuning the photon energy to the O K edge region results in the dominant photoexcitation of 13CO or H2O. Examples of X-ray photodesorption spectra from the mixed ices are shown in Fig. 4. In the top panels we display the X-ray photodesorption yields of the m/z 29, which we attribute to 13CO desorption in the N K edge region (395–420 eV), and of the m/z 41, which we attribute to CH3CN desorption in the O K edge region (525–555 eV) from 13CO:CH3CN ices. The variations in photodesorption yields with the photon energy follow that of the TEYs (displayed as dashed lines), that is, the photoabsorption spectrum of the ice. This behavior indicates an indirect photodesorption mechanism in the sense that the photodes-orbing molecule is different from the photoexcited one. The top panels of Fig. 4 clearly show that photoexciting CH3CN or 13CO in the N and O K edge region induces the desorption of 13CO and CH3CN, respectively, from the mixed 13CO:CH3CN ices.
Indirect desorption mechanisms induced by X-ray irradiation of ices have already been highlighted in similar experiments on methanol-containing ices (Basalgète et al. 2021a,b) and on CO/N2 ices (Basalgète et al. 2022). In these studies, it was suggested that the indirect desorption is driven by the scattering of the Auger electrons and the subsequent low-energy secondary electrons toward the ice surface, following the Auger decay of the core hole excited or ionized state of the photoabsorbing molecule. This mechanism, known as X-ray induced electron stimulated desorption (XESD), was also proposed to occur for pure ices of H2O (Dupuy et al. 2018) and CO (Dupuy et al. 2021). We also expect this mechanism to explain the X-ray photodes-orption of the neutral species detected in our experiments with acetonitrile-containing ices. Other indirect mechanisms could include the codesorption of molecules at the ice surface, which is not necessarily induced by the secondary electrons, but by the fate of the photoexcited molecule after Auger decay.
Additionally, the scattering of the Auger and secondary electrons induces chemistry near the ice surface. The X-ray photodesorption of masses associated with photoproducts were observed during our experiments. Some examples are shown in the bottom panels of Fig. 4 for the X-ray photodesorption signals on the m/z 44 and m/z 28 from a 13CO:CH3CN ice (1:1) and a H2O:CH3CN ice (1:1), respectively. The fact that the X-ray photodesorption spectra of these masses follow the TEY indicates that these photoproducts originate from the chemistry induced by the low-energy electrons. More globally, when a photodes-orption signal was clearly detected during the experiments, the corresponding photodesorption spectrum was found to follow the TEY of the ice.
Many mass channels displayed a desorption signal during the experiments performed on mixed ices. In order to discuss the attribution of the neutral species to these signals, we show in Fig. 5 the X-ray photodesorption intensities associated with the mass channels we monitored. The displayed intensities are not corrected for any possible fragmentation pattern of the des-orbing species. They were derived at 560 eV energy, at which the photoabsorption is dominated by the core ionization of O-bearing species, with a similar cross section for 13CO and H2O. For similar dilution ratios, potential differences observed in the desorption intensities at 560 eV can therefore be solely attributed to differences in the ice composition. Additionally, the intensities displayed in Fig. 5 were obtained for a low photon fluence (<2 × 10¹⁶ photons cm−2) in order to limit the destruction effects of CH3CN before the measurements as much as possible. This is particularly efficient in H2O-dominated ices, as explained in Sect. 3.1.
The m/z 16 and 15 signals depend on the ice composition. For the 13CO-mixed ices, the m/z 16 intensity increases with the amount of 13CO that is initially deposited and it is below our detection limit after correcting it for the fragmentation of desorbing 13CO into atomic O at the QMS entrance for both mixtures. Consequently, we attribute the intensities we observed on the m/z 15 on the 13CO-mixed ices to CH3 desorption. For the H2O-mixed ices, the intensities observed on the m/z 16 and 15 are consistent with the desorption of CH4, which should produce a similar signal on these mass channels due to its fragmentation at the QMS entrance. After the cracking of m/z 16 (CH4) into m/z 15 (CH3) was corrected for, the intensities on the m/z 15 from the H2O-mixed ices were not high enough to consider a significant desorption of CH3. We therefore conclude that the m/z 16 and 15 signals from the H2O-mixed ices are solely due to CH4 desorption.
The X-ray photodesorption of the m/z 28 and 30 significantly depends on the ice composition. No desorption signal was detected on the m/z 30 from the H2O:CH3CN ices. For the 13CO-mixed ices, isotopic impurities present in our 13C16O gas sample contribute to the desorption signals observed on the m/z 28 and 30. Mass signals on the m/z 28 and 30 were found in the mass spectrum of our 13C16O gas sample, which was measured after the synchrotron experiments. These mass signals originate from 12C16O and 12C18O in the gas sample. It was estimated from the mass spectrum that ~1% of 12C16O and ~0.5% of 12C18O relative to 13C16O were present in our sample. In the X-ray photodesorption experiments from the 13CO-mixed ices, a significant desorption signal was detected on the m/z 29, which is attributed to the X-ray photodesorption of 13C16O. The intensities measured on the m/z 29 and 30 from the 13CO-mixed ices both increase from the 1:1 to the 7:1 mixtures. Moreover, the ratio of the m/z 30 intensity to that of the m/z 29 was found to be ~0.5% for both mixtures, which is similar to the estimated amount of 12C18O impurities present in our 13C16O gas sample. We therefore conclude that the desorption signal observed on the m/z 30 from the 13CO-mixed ices solely originates from 12C18O X-ray photodesorption due to the isotopic impurity deposited with the 13C16O matrix.
Unlike the m/z 30, the desorption intensities measured on the m/z 28 from the 13CO-mixed ices cannot be only attributed to the desorption of the 12C16O isotopic impurity deposited in the 13C16O matrix. The part of the m/z 28 desorption intensity attributed to the 12C16O impurity desorption is estimated as 1% of the 13C16O (m/z 29) desorption intensity, and it is displayed in the striped rectangles in Fig. 5. A significant part of the m/z 28 intensity should therefore originate from the desorption of photoproducts. For both the 13CO-mixed and H2O-mixed ices, the high desorption intensity as compared to the other mass channels indicates photoproducts with a high desorption efficiency, such as 12C16O or N2. Their X-ray photodesorption yields from their pure respective ice are found to be similar, and they are ~0.1 molecules photon-1 (at 420 eV for N2 and 560 eV for CO; Dupuy et al. 2021; Basalgète et al. 2022). The accumulation of CO near the ice surface, which should be visible in the TEY data near 534.4 eV, is not observed in the mixed H2O:CH3CN ices (see the top panel of Fig. C.1), whereas N2 accumulation is clearly seen in the TEY near 401 eV, even in the low-fluence regime at which the intensities were derived (see the right panels of Fig. 1). This might indicate that the desorption of the m/z 28 from mixed H2O:CH3CN ices is dominated by the X-ray photodesorption of N2, although a contribution of CO desorption cannot be totally ruled out. For the 13CO:CH3CN ices, the accumulation of N2 is also visible in the TEY near the N K edge, but the formation of 12CO cannot be discussed regarding the TEY near the O K edge because 13CO and 12CO core absorption features should be similar in that energy range. Therefore, we cannot clearly attribute desorbing species to the m/z 28 signals for the mixed ices. It is unclear why this signal increases with the dilution of CH3CN in the 13CO-mixed ices but is similar in the H2O-mixed ices for both dilution ratios.
The m/z 27 intensities observed for mixed 13CO:CH3CN and H2O:CH3CN ices decrease when CH3CN is more diluted. This indicates the X-ray photodesorption of HCN. This decrease is somewhat consistent with the fact that this molecule might desorb following the dissociation of CH3CN at the ice surface, for example, via DEA due to low-energy electrons (Bass et al. 2012). This monomolecular process should not be hindered by the surrounding 13CO or H2O molecules, but the associated desorption signal should be less detectable when fewer CH3CN molecules are present at the ice surface. A lower desorption signal of HCN for the case of H2O:CH3CN ices compared to the 13CO:CH3CN ices with similar dilution ratios might be due to (i) a higher desorption barrier to overcome in the case of mixed H2O:CH3CN ices, or (ii) the fact that CH3CN is more rapidly consumed hence present in smaller numbers at the ice surface for the case of mixed H2O:CH3CN ices, even for the low-fluence regime in which the signals were measured.
The desorption intensities of the m/z 41 are attributed to CH3CN X-ray photodesorption. In mixed 13CO:CH3CN ices, it decreases when CH3CN is more diluted. The signals in the H2O:CH3CN ices are lower than in the 13CO:CH3CN ices for similar dilution ratios, indicating that mixing CH3CN with water tends to hinder its X-ray photodesorption. As for the case of HCN, this could be due to either a difference in adsorption energies between CH3CN and the water or the 13CO matrix, or it could be due to a rapid consumption of CH3CN by X-ray induced chemistry when it is mixed with water. Desorption signals on higher m/z than 41, namely 42, 43, and 44, were observed from the mixed ices. The desorbing species cannot be clearaly attributed to these mass channels because these mass channels can correspond to 12CNO, H12CNO, and 12CO2 for the m/z 42, 43, and 44, respectively, or they can originate from the fragmentation of molecules of higher mass at the QMS entrance. The relative intensity of these signals between the 13CO-dominated and H2O-dominated ice indicates a different X-ray induced chemistry. H12CNO desorption from the H2O-mixed ices and further fragmentation at the QMS entrance might explain the signals observed on the m/z 42 and 43. The relative intensities of these signals are not consistent with the mass spectrum measured in Hand & Bogan (1971), but the large uncertainties make it difficult to firmly exclude HCNO. Its formation in our H2O-mixed ices is supported by the detection of its conjugated base, OCN−, in 0.8 MeV proton and far-UV irradiated H2O:CH3CN ices in the study of Hudson & Moore (2004). In the presence of water, taking inspiration from the H+ assisted hydrolysis of nitrile, the induced chemistry might result in the conversion of the nitrile function into an amide group R-CO-NH2. Part of the m/z 44, whose global intensity is doubled in the case of the mixed H2O:CH3CN ices compared to the mixed 13CO:CH3CN ices, can be attributed to the carbamoyl-ionized radical [H2N-CO]+, for example, resulting from the cracking of acetamide CH3-CONH2. Another possibility to explain the m/z 44 signal from the H2O-mixed ices would be the desorption and further fragmentation of formamide HCONH2. Formamide desorption should produce a signal on the m/z 45 that is higher than the m/z 43 and 44 according to the NIST database (Linstrom & Mallard 2022), however. As we did not detect a desorption signal on the m/z 45 from the H2O-mixed ices, we might exclude formamide desorption even if the large uncertainties prevent us from concluding this definitively. Both acetamide and formamide have been proposed as possible photoproducts in the VUV photolysis of H2O:CH3CN ices (Bulak et al. 2021).
After conversion of the desorption intensities into desorption yields, we display in Table 2 the X-ray photodesorption yields at 560 eV that are associated with the identified species from the mixed ices, with dilution ratios that are the most representative of interstellar ices, that is the higher ratios.
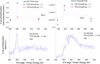 |
Fig. 4 X-ray photodesorption spectra from mixed ices. Top panels: X-ray photodesorption yields of 13CO near the N K edge and of CH3CN near the O K edge (squares with error bars) from a mixed 13CO:CH3CN ice at 15 K, with dilution ratios of 1:1 (blue) and 7:1 (red). The yields were measured for a fresh ice at 15 K having received a photon fluence < 1 × 10¹⁶ photons cm−2. The TEYs, measured at higher fluences (5–10 × 1016 photons cm−2), are displayed as dashed lines. Bottom panels: X-ray photodesorption spectra (blue) of the m/z 44 from a 13CO:CH3CN (1:1) ice near the N K edge (left panel) and of the m/z 28 from a H2O:CH3CN (1: 1) ice near the O K edge (right panel). In red we also display the TEYs. The photodesorption signals and the TEYs were measured simultaneously at 15 K. The Y-scale of the bottom panels is in arbitrary units. |
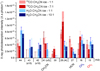 |
Fig. 5 X-ray photodesorption intensities divided by the photon flux (in A s photon−1) at 560 eV of desorbing masses from mixed 13CO:CH3CN and H2O:CH3CN ices, irradiated at 15 K. The attribution of the desorbing species to the mass channels is displayed for the m/z 41, 27, 16, and 15. For the other mass channels, this attribution depends on the ice composition. This is discussed in the text. The signals were obtained for a fluence < 2 × 10¹⁶ photons cm−2 and are not corrected for any possible fragmentation of desorbing species in the ionization stage of our QMS. The striped rectangles displayed on the m/z 28 for the 13CO-mixed ices correspond to the contribution of desorbing 12C16O originating from the isotopic impurities in our 13CO gas sample, as estimated in the text. |
X-ray photodesorption yields in molecules desorbed per incident photon (in 10−4 molecules photon−1) of CH3CN, HCN, CH4, and CH3 at 560 eV from mixed 13CO:CH3CN and H2O:CH3CN ices irradiated at 15 K.
4 Astrophysical yields and discussion
The most important finding of this study is that X-ray photodesorption of intact CH3CN from interstellar ices is a possible process and might partly explain the observation of CH3CN in protoplanetary disks (Öberg et al. 2015; Bergner et al. 2018; Loomis et al. 2018). According to our experimental results, the efficiency of this process should depend on the ice composition and hence on the disk region that is considered. Namely, in regions in which CH3CN is mixed in CO-dominated ices at the ice surface, the X-ray photodesorption yield of CH3CN is expected to be higher than the one corresponding to the regions in which CH3CN is mixed in H2O-dominated ices at the ice surface. X-ray photodesorption of photofragments, for instance, HCN, CH4, and CH3, should also enrich the gas phase of disks with these molecules. The effect of the ice temperature on the X-ray photodesorption yields remains to be studied because it varies with the regions of the disk that are considered, with H2O ices being warmer than CO ices. Although it was shown that X-ray irradiation alone can promote diffusion of species in ices (Jimenez-Escobar et al. 2022), the increase in ice temperature should also favor the diffusion of photoproducts and might influence the photodesorption. Due to the indirect desorption processes observed in our experiments, most probably mediated by the Auger scattering and the subsequent cascade of low-energy secondary electrons, the X-ray photoabsorption of any subsurface molecule in interstellar ices should induce the desorption of surface molecules. The ice depth involved in this indirect process is expected to be a few tens of ML in the soft X-ray range, based on similar X-ray experiments (Basalgète et al. 2022).
In order to provide quantitative data that could be easily implemented in astrochemical models, we derive in Table 3 astrophysical yields according to the method described in Sect. 2, that is, by extrapolation of the experimental yields in the 0.4–10 keV and by averaging them on the estimated local X-ray spectrum, which depends on the column density of gas and dust NH traversed by the stellar X-rays. The X-ray emission spectrum is that of a typical T-Tauri star, taken from Nomura et al. (2007), and the attenuation cross section of gas and dust is taken from Bethell & Bergin (2011). We consider in Table 3 the case where CH3CN is diluted in a CO-dominated or H2O-dominated ice, which corresponds to the higher dilution ratios studied in our experiments (7:1 for the CO-dominated ice and 10:1 for the H2O-dominated ice). For a given ice composition, the astrophysical yields vary by two orders of magnitude, depending on the local X-ray spectrum and hence on the disk region that is considered.
For regions in which hard X-rays (> 1 keV) dominate the spectrum (see Fig. B.1), the photodesorption yields are lowest. This is due to our extrapolation that results in yields that are several orders of magnitude lower for hard X-rays than for soft X-rays. This extrapolation represents a non-negligible uncertainty on the yields displayed in Table 3, and additional experiments should be conducted in the hard X-ray range to estimate its accuracy. It might indeed be expected that for these energies, the X-ray photoabsorption results in the scattering of both the primary ionized 1s electron and the Auger electron toward the ice surface, inducing desorption. As the kinetic energy of the 1 s electron increases with the X-ray energy, a deviation of the photodesorption yields from the photoabsorption cross section might be observed for hard X-rays.
For CO-dominated ices and for a similar attenuation of the X-ray irradiation spectrum, the estimated astrophysical X-ray photodesorption yields of CH3CN are found to be in the same order of magnitude than that of another important COM in astrochemistry, methanol CH3OH (Basalgète et al. 2021b). Moreover, the X-ray photodesorption behavior of the intact COM is found to be similar between CH3CN-containing ices and CH3OH-containing ices (Basalgète et al. 2021b). The X-ray photodesorption yield of the intact COM, either CH3CN or CH3OH, is estimated to be lower in the case of H2O-dominated ices than in the case of CO-dominated ices. For both COMs, this is assumed to be due to a difference in the X-ray induced chemistry between H2O-dominated and CO-dominated ices: in the water matrix, chemical reactions between the intact COM and most probably OH radical tend to increase the destruction kinetic of the COM, which competes with its intact desorption. Interestingly, experiments in the VUV range on CH3CN-containing ices and CH3OH-containing ices display a different behavior of the intact COM desorption. For CO-dominated ices, the VUV photodesorption of CH3CN (~10−5 molecules photon−1 at 10.5 eV, from Basalgète et al. 2021c) is found to be at least an order of magnitude higher than that of CH3OH (only an upper limit of ~10−6 molecules photon−1 has been derived in Bertin et al. 2016). Additionally, the VUV photodesorption of CH3CN is found to be independent of the studied ice composition (pure CH3CN ices, CO:CH3CN ices, or H2O:CH3CN ices; Basalgète et al. 2021c), in contrast to what is observed in the X-ray range in our study. This shows that X-ray and VUV photodesorption of COMs should not be treated similarly in astrochemical models as very different physical-chemical mechanisms are expected to be at play for these processes. Finally, it is not straightforward to conclude on the dominant role of either VUV photons or X-rays for the photodesorption of COMs in protoplanetary disks by solely considering our experimental data. Our X-ray yields are found to significantly depend on the disk region considered, and they are found to be either superior or inferior to the VUV yields by an order of magnitude. For CH3CN, the maximum astrophysical yield derived, which is ~10−4 molecules photon−1, is still an order of magnitude lower than what is used in the study of Loomis et al. (2018). In order to easily extrapolate our experimental results to environments other than protoplanetary disks, we also provide in Table 4 the X-ray photodesorption yields in units of absorbed photons by using the yields at 560 eV from Table 2.
X-ray astrophysical photodesorption yields in molecules desorbed per incident photon (molecules photon−1) of CH3 CN, HCN, CH4, and CH3 from CO-dominated and H2O-dominated ices at 15 K.
X-ray photodesorption yields in 10−2 molecules desorbed per absorbed photon of CH3CN, HCN, CH4, and CH3 from mixed 13CO:CH3CN and H2O:CH3CN ices irradiated at 15 K.
5 Conclusion
X-ray photodesorption of neutral species from CH3CN-containing ices was studied in the soft X-ray range in the N and O K edge regions (395- 420 eV and 530–555 eV, respectively). X-ray photodesorption yields of CH3CN, HCN, CH4, and CH3 were derived for pure CH3CN ice, 13CO:CH3CN ices, and H2O:CH3CN ices. The yields were found to depend on the photon energy and on the ice composition. Indirect desorption processes, induced by photoexcitation of either CH3CN, 13CO, or H2O, and most probably mediated by the Auger scattering and the subsequent cascade of low-energy electrons, were observed. The X-ray photodesorption yield at 560 eV of the intact CH3CN was estimated to be higher by at least half an order of magnitude when CH3CN is mixed in CO-dominated ices compared to the case where it is mixed in H2O-dominated ices.
X-ray photodesorption of intact CH3CN from interstellar ices might partly explain the abundances of gas-phase CH3CN observed in protoplanetary disks. The desorption efficiency depends on the local X-ray irradiation spectrum and on the ice composition and hence on the disk region that is considered. In order to facilitate the implementation of X-ray photodesorption in disk modeling, we derived astrophysical yields, averaged in the 0.4–10 keV range, as a function of the local conditions expected in disks. For the desorption of the intact CH3CN, these astrophysical yields vary from ~10−4 molecules photon−1 to ~10−6 molecules photon−1 from CO-dominated ices. Only upper limits, from ~5 × 10⁻⁵ molecules photon−1 to ~5 × 10⁻⁷ molecules photon−1, could be derived for the X-ray photodesorption of CH3CN from H2O-dominated ices.
Acknowledgements
This work was carried out with financial support from the Region Ile-de-France DIM-ACAV + program; the Sorbonne Université “Emergence” program; the ANR PIXyES project, Grant No. ANR-20-CE30-0018 of the French “Agence Nationale de la Recherche”; and the Program National “Physique et Chimie du Milieu Interstellaire” (PCMI) of CNRS/INSU with INC/INP cofunded by CEA and CNES. We would like to acknowledge SOLEIL for the provision of synchrotron radiation facilities under Project No. 20210142 and N. Jaouen, H. Popescu, and R. Gaudemer for their help on the SEXTANTS beam line.
Appendix A Raw desorption mass signals
In Figure A.1 and A.2, we display some examples of QMS signals obtained during the experiments we conducted. As explained in the text, the desorption intensities IX(E) are deduced from these data either by computing the signal height (with respect to the background level) corresponding to the irradiation step at fixed energy (Figure A.1) or by subtracting the background fit from the continuous mass signal corresponding to an irradiation scan (Figure A.2).
The X-ray photodesorption yields displayed in Tables 1 and 2 are derived from the fixed energy experiments. The uncertainties shown in these tables and the error bars also displayed in Figure 3 and 4 are associated with the signal-to-noise ratio of the QMS mass signals (see Figure A.1). First, the uncertainties associated with IX(E), δIX(E), are estimated as the sum of the half-height of the signal noise in the background and at the top of each peak for the corresponding irradiation step. Then, for each energy and each species, the uncertainties associated with the X-ray photodesorption yields δΓX(E), which are displayed in the mentioned tables and figures, are deduced from the following equation:
 (A.1)
(A.1)
Equation A.1 results in experimental uncertainties that depend on the photon energy. Finally, these uncertainties only reflect the quality of the recorded signals and do not take the uncertainty associated with the calibration of kX into account, which is systemic. These uncertainties do not affect the shape of the X-ray photodesorption spectra, but only the uncertainties on the absolute values of the photodesorption yields. It mainly depends on the uncertainties associated with the apparatus function of the QMS and on the electron-impact ionization cross sections. We estimate these latter uncertainties to be in the order of magnitude of 50% relative to the derived photodesorption yields.
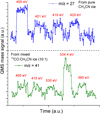 |
Fig. A.1 X-ray photodesorption QMS signals of m/z 27 from pure CH3CN ice (top part) and of m/z 41 from mixed 13CO:CH3CN (10:1) ice (bottom part), both irradiated at 15 K and at a fixed photon energy for a few tens of seconds. The fixed energies at which the ice is irradiated are indicated in red for each irradiation step. The QMS signals are scaled for more clarity, meaning that the relative intensities between the m/z 27 and 41 signals do not represent the actual ones. |
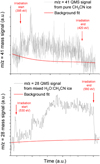 |
Fig. A.2 Examples of raw photodesorption spectra from the studied ices. Top panel: X-ray photodesorption QMS signal of m/z 41 from pure CH3CN ice irradiated at 15 K by scanning the incident photon energy between 395 eV and 420 eV. Bottom panel: X-ray photodesorption QMS signal of m/z 28 from mixed H2O:CH3CN (1:1) ice irradiated at 15 K by scanning the incident photon energy between 530 eV and 560 eV. The start and the end of the irradiation are shown by the red arrows. |
Appendix B Astrophysical X-ray photodesorption yields
In order to derive X-ray photodesorption yields averaged over the 0.4 - 10 keV range, referred to as astrophysical yields, we used the method described in Section 2 that is summarized in equation 2. In this equation, ϕlocal is estimated by taking the X-ray emission source spectrum of a typical T-Tauri star ϕsource (taken from Nomura et al. (2007)) and by attenuating it using the photoelectric cross section σatt of gas and dust from Bethell & Bergin (2011). This results in the following formula:
 (B.1)
(B.1)
where NH is the column density of gas and dust traversed by the X-rays. The corresponding local X-ray spectra ϕlocal, expected to irradiate the interstellar ices, depend on the disk region and are displayed in Figure B.1.
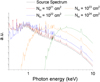 |
Fig. B.1 Normalized source and attenuated X-ray spectrum of a typical T-Tauri star. The source spectrum is taken from Nomura et al. (2007). |
Equation 2 necessitates extrapolating the experimental X-ray photodesorption yields ΓX, derived in Section 3, to higher X-ray energies. As explained in Section 2, this extrapolation consists of assuming that the yields follow the O 1s ionization cross section of CO (or similarly H2O) taken from Berkowitz (2002). As the X-ray photodesorption of CH3CN from a mixed H2O:CH3CN (10:1) ice is below our detection limit, we considered for the extrapolation that the CH3CN yield was in that case equal to our upper limit, which is 10−4 molecules photon−1, in the 395 -560 eV range. The extrapolated CH3CN X-ray photodesorption yields from mixed 13CO:CH3CN (10:1) and H2O:CH3CN (10:1) are displayed in Figure B.2
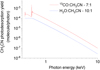 |
Fig. B.2 X-ray photodesorption yields of CH3CN from mixed 13CO:CH3CN (10:1) and H2O:CH3CN (10:1) ices at 15 K, extrapolated from 0.4 to 10 keV according to the methodology described in Section 2. |
Appendix C Total electron yields near the O K edge with photon fluence
In Figure C.1, we display the TEYs measured from mixed H2O:CH3CN and 13CO:CH3CN ices irradiated at 15 K near the O K edge as a function of the photon fluence. The features observed are similar to that corresponding to pure H2O and pure CO ice that were studied in Dupuy et al. (2020) and Dupuy et al. (2021). As explained in the text, no significant new features are detected in these TEYs data, showing that potential photoproducts that formed during X-ray irradiation do not strongly participate in the ice absorption in this energy range. The evolution of the feature observed near 535.4 eV with the photon fluence for the mixed H2O:CH3CN ice is most likely due to a slight change in the structure of the water ice. As discussed in Dupuy et al. (2020), this feature can be associated with single-donor weakly coordinated H2O molecules in the water ice, which might increase after the formation of defects due to X-ray irradiation at 15 K.
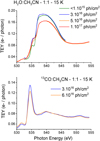 |
Fig. C.1 TEYs near the O K edge of a mixed H2O:CH3CN ice irradiated at 15 K with a dilution ratio of 1 :1 (top panel) and of a mixed 13CO:CH3CN ice irradiated at 15 K with a dilution ratio of 1:1 (bottom panel). The photon fluence received by the ice before the TEY measurement is also displayed. |
References
- Abdoul-Carime, H., Thiam, G., Rabilloud, F., Charlieux, F., & Kopyra, J. 2022, ACS Earth Space Chem., 6, 1126 [NASA ADS] [CrossRef] [Google Scholar]
- Basalgète, R., Dupuy, R., Féraud, G., et al. 2021a, A&A, 647, A35 [NASA ADS] [CrossRef] [EDP Sciences] [Google Scholar]
- Basalgète, R., Dupuy, R., Féraud, G., et al. 2021b, A&A, 647, A36 [EDP Sciences] [Google Scholar]
- Basalgète, R., Ocaña, A. J., Féraud, G., et al. 2021c, ApJ, 922, 213 [CrossRef] [Google Scholar]
- Basalgète, R., Torres-Díaz, D., Lafosse, A., et al. 2022, J. Chem. Phys., 157, 084308 [CrossRef] [Google Scholar]
- Bass, A. D., Bredehöft, J. H., Böhler, E., Sanche, L., & Swiderek, P. 2012, Eur. Phys. J. D, 66, 53 [NASA ADS] [CrossRef] [Google Scholar]
- Bergner, J. B., Guzmán, V. G., Öberg, K. I., Loomis, R. A., & Pegues, J. 2018, ApJ, 857, 69 [Google Scholar]
- Berkowitz, J. 2002, Atomic and Molecular Photoabsorption: Absolute Total Cross Sections (San Diego, CA: Academic Press) [Google Scholar]
- Bertin, M., Romanzin, C., Doronin, M., et al. 2016, ApJ, 817, L12 [NASA ADS] [CrossRef] [Google Scholar]
- Bertin, M., Doronin, M., Fillion, J.-H., et al. 2017, A&A, 598, A18 [NASA ADS] [CrossRef] [EDP Sciences] [Google Scholar]
- Bethell, T. J., & Bergin, E. A. 2011, ApJ, 740, 7 [NASA ADS] [CrossRef] [Google Scholar]
- Bulak, M., Paardekooper, D., Fedoseev, G., & Linnartz, H. 2021, A&A, 647, A82 [NASA ADS] [CrossRef] [EDP Sciences] [Google Scholar]
- Chen, C. T., Ma, Y., & Sette, F. 1989, Phys. Rev. A, 40, 6737 [NASA ADS] [CrossRef] [Google Scholar]
- Ciaravella, A., Muñoz Caro, G. M., Jiménez-Escobar, A., et al. 2020, PNAS, 117, 16149 [NASA ADS] [CrossRef] [Google Scholar]
- Dupuy, R., Bertin, M., Féraud, G., et al. 2018, Nat. Astron., 2, 796 [CrossRef] [Google Scholar]
- Dupuy, R., Féraud, G., Bertin, M., et al. 2020, J. Chem. Phys., 152, 054711 [NASA ADS] [CrossRef] [Google Scholar]
- Dupuy, R., Bertin, M., Féraud, G., et al. 2021, Phys. Chem. Chem. Phys., 23, 15965 [NASA ADS] [CrossRef] [Google Scholar]
- Feigelson, E. D. 2010, PNAS, 107, 7153 [NASA ADS] [CrossRef] [Google Scholar]
- Güdel, M., & Nazé, Y. 2009, A&ARv, 17, 309 [Google Scholar]
- Hand, C. W., & Bogan, D. J. 1971, J. Phys. Chem., 75, 1532 [CrossRef] [Google Scholar]
- Hudson, R., & Moore, M. 2004, Icarus, 172, 466 [Google Scholar]
- Ipolyi, I., Michaelis, W., & Swiderek, P. 2007, Phys. Chem. Chem. Phys., 9, 180 [NASA ADS] [CrossRef] [Google Scholar]
- Jiménez-Escobar, A., Ciaravella, A., Cecchi-Pestellini, C., et al. 2018, ApJ, 868, 73 [Google Scholar]
- Jimenez-Escobar, A., Ciaravella, A., Cecchi-Pestellini, C., et al. 2022, ApJ, 926, 176 [NASA ADS] [CrossRef] [Google Scholar]
- Jugnet, Y., Himpsel, F. J., Avouris, P., & Koch, E. E. 1984, Phys. Rev. Lett., 53, 198 [NASA ADS] [CrossRef] [Google Scholar]
- Linstrom, P., & Mallard, W. 2022, NIST Standard Reference Database, 69, 20899 [Google Scholar]
- Loomis, R. A., Cleeves, L. I., Öberg, K. I., et al. 2018, ApJ, 859, 131 [Google Scholar]
- Nomura, H., Aikawa, Y., Tsujimoto, M., Nakagawa, Y., & Millar, T. J. 2007, ApJ, 661, 334 [NASA ADS] [CrossRef] [Google Scholar]
- Notsu, S., van Dishoeck, E. F., Walsh, C., Bosman, A. D., & Nomura, H. 2021, A&A, 650, A180 [NASA ADS] [CrossRef] [EDP Sciences] [Google Scholar]
- Öberg, K. I., Guzmán, V. V., Furuya, K., et al. 2015, Nature, 520, 198 [Google Scholar]
- Pandya, S. H., Shelat, F. A., Joshipura, K., & Vaishnav, B. G. 2012, Int. J. Mass Spectrom., 323-324, 28 [Google Scholar]
- Parent, P., Laffon, C., & Bournel, F. 2000, J. Chem. Phys., 112, 986 [NASA ADS] [CrossRef] [Google Scholar]
- Sacchi, M., Jaouen, N., Popescu, H., et al. 2013, J. Phys.: Conf. Ser., 425, 072018 [NASA ADS] [CrossRef] [Google Scholar]
- Tarnovsky, V., Levin, A., Deutsch, H., & Becker, K. 1996, J. Phys. B: At. Mol. Opt. Phys., 29, 139 [CrossRef] [Google Scholar]
- Testa, P. 2010, PNAS, 107, 7158 [NASA ADS] [CrossRef] [Google Scholar]
- Tian, C., & Vidal, C. R. 1998, J. Phys. B: At. Mol. Opt. Phys., 31, 895 [CrossRef] [Google Scholar]
- Tîmneanu, N., Caleman, C., Hajdu, J., & van der Spoel, D. 2004, Chem. Phys., 299, 277 [CrossRef] [Google Scholar]
- Zhou, W., Wilkinson, L., Lee, J. W. L., Heathcote, D., & Vallance, C. 2019, Mol. Phys., 117, 3066 [Google Scholar]
All Tables
X-ray photodesorption yields in molecules desorbed per incident photon (molecules photon−1) of CH3CN, HCN, and CH3 from pure CH3CN ices irradiated at 15 K and at a photon energy of 420 eV.
X-ray photodesorption yields in molecules desorbed per incident photon (in 10−4 molecules photon−1) of CH3CN, HCN, CH4, and CH3 at 560 eV from mixed 13CO:CH3CN and H2O:CH3CN ices irradiated at 15 K.
X-ray astrophysical photodesorption yields in molecules desorbed per incident photon (molecules photon−1) of CH3 CN, HCN, CH4, and CH3 from CO-dominated and H2O-dominated ices at 15 K.
X-ray photodesorption yields in 10−2 molecules desorbed per absorbed photon of CH3CN, HCN, CH4, and CH3 from mixed 13CO:CH3CN and H2O:CH3CN ices irradiated at 15 K.
All Figures
|
Fig. 1 TEYs in the N K edge region of a pure CH3CN ice at 15 K (top left panel; the inset shows the region near the N 1s → π* resonance for an ice irradiated at 15 K and 90 K for the lower and upper curve, respectively; these curves are shifted vertically for more clarity), of a mixed H2O:CH3CN ice irradiated at 15 K with a dilution ratio of 1:1 and 10:1 (top and bottom right panel, respectively), and of a mixed 13CO:CH3CN ice irradiated at 15 K with a dilution ratio of 1:1 (bottom left panel). The photon fluence received by the ice before each TEY measurement is also displayed. The spectral width of the beam was set to 1.2 eV for all the TEY measurements, except for the one corresponding to the red curve in the bottom right panel, for a H2O:CH3CN ice having received a photon fluence of 1×10¹⁷ photons cm−2 and for which the spectral width was 90 meV. The inset in the bottom right panel zooms into the TEY measured on the H2O:CH3CN (10:1) ice for a photon fluence of 1017 photons cm−2, where the vibrational structure of the core hole state of N2 formed near the ice surface can be seen near 401 eV. The ices have a total thickness of ~100 ML. |
| In the text | |
|
Fig. 2 X-ray photodesorption intensities divided by the photon flux (in A s photon−1) at 420 eV of desorbing species from pure acetonitrile ices. The mass channels monitored during the experiments are indicated on the X-axis. The attribution of these mass channels to desorbing neutral species is discussed in the text. The different colors are associated with a natural |
| In the text | |
|
Fig. 3 X-ray photodesorption yields of |
| In the text | |
|
Fig. 4 X-ray photodesorption spectra from mixed ices. Top panels: X-ray photodesorption yields of 13CO near the N K edge and of CH3CN near the O K edge (squares with error bars) from a mixed 13CO:CH3CN ice at 15 K, with dilution ratios of 1:1 (blue) and 7:1 (red). The yields were measured for a fresh ice at 15 K having received a photon fluence < 1 × 10¹⁶ photons cm−2. The TEYs, measured at higher fluences (5–10 × 1016 photons cm−2), are displayed as dashed lines. Bottom panels: X-ray photodesorption spectra (blue) of the m/z 44 from a 13CO:CH3CN (1:1) ice near the N K edge (left panel) and of the m/z 28 from a H2O:CH3CN (1: 1) ice near the O K edge (right panel). In red we also display the TEYs. The photodesorption signals and the TEYs were measured simultaneously at 15 K. The Y-scale of the bottom panels is in arbitrary units. |
| In the text | |
|
Fig. 5 X-ray photodesorption intensities divided by the photon flux (in A s photon−1) at 560 eV of desorbing masses from mixed 13CO:CH3CN and H2O:CH3CN ices, irradiated at 15 K. The attribution of the desorbing species to the mass channels is displayed for the m/z 41, 27, 16, and 15. For the other mass channels, this attribution depends on the ice composition. This is discussed in the text. The signals were obtained for a fluence < 2 × 10¹⁶ photons cm−2 and are not corrected for any possible fragmentation of desorbing species in the ionization stage of our QMS. The striped rectangles displayed on the m/z 28 for the 13CO-mixed ices correspond to the contribution of desorbing 12C16O originating from the isotopic impurities in our 13CO gas sample, as estimated in the text. |
| In the text | |
|
Fig. A.1 X-ray photodesorption QMS signals of m/z 27 from pure CH3CN ice (top part) and of m/z 41 from mixed 13CO:CH3CN (10:1) ice (bottom part), both irradiated at 15 K and at a fixed photon energy for a few tens of seconds. The fixed energies at which the ice is irradiated are indicated in red for each irradiation step. The QMS signals are scaled for more clarity, meaning that the relative intensities between the m/z 27 and 41 signals do not represent the actual ones. |
| In the text | |
|
Fig. A.2 Examples of raw photodesorption spectra from the studied ices. Top panel: X-ray photodesorption QMS signal of m/z 41 from pure CH3CN ice irradiated at 15 K by scanning the incident photon energy between 395 eV and 420 eV. Bottom panel: X-ray photodesorption QMS signal of m/z 28 from mixed H2O:CH3CN (1:1) ice irradiated at 15 K by scanning the incident photon energy between 530 eV and 560 eV. The start and the end of the irradiation are shown by the red arrows. |
| In the text | |
|
Fig. B.1 Normalized source and attenuated X-ray spectrum of a typical T-Tauri star. The source spectrum is taken from Nomura et al. (2007). |
| In the text | |
|
Fig. B.2 X-ray photodesorption yields of CH3CN from mixed 13CO:CH3CN (10:1) and H2O:CH3CN (10:1) ices at 15 K, extrapolated from 0.4 to 10 keV according to the methodology described in Section 2. |
| In the text | |
|
Fig. C.1 TEYs near the O K edge of a mixed H2O:CH3CN ice irradiated at 15 K with a dilution ratio of 1 :1 (top panel) and of a mixed 13CO:CH3CN ice irradiated at 15 K with a dilution ratio of 1:1 (bottom panel). The photon fluence received by the ice before the TEY measurement is also displayed. |
| In the text | |
Current usage metrics show cumulative count of Article Views (full-text article views including HTML views, PDF and ePub downloads, according to the available data) and Abstracts Views on Vision4Press platform.
Data correspond to usage on the plateform after 2015. The current usage metrics is available 48-96 hours after online publication and is updated daily on week days.
Initial download of the metrics may take a while.