Fig. 1
Download original image
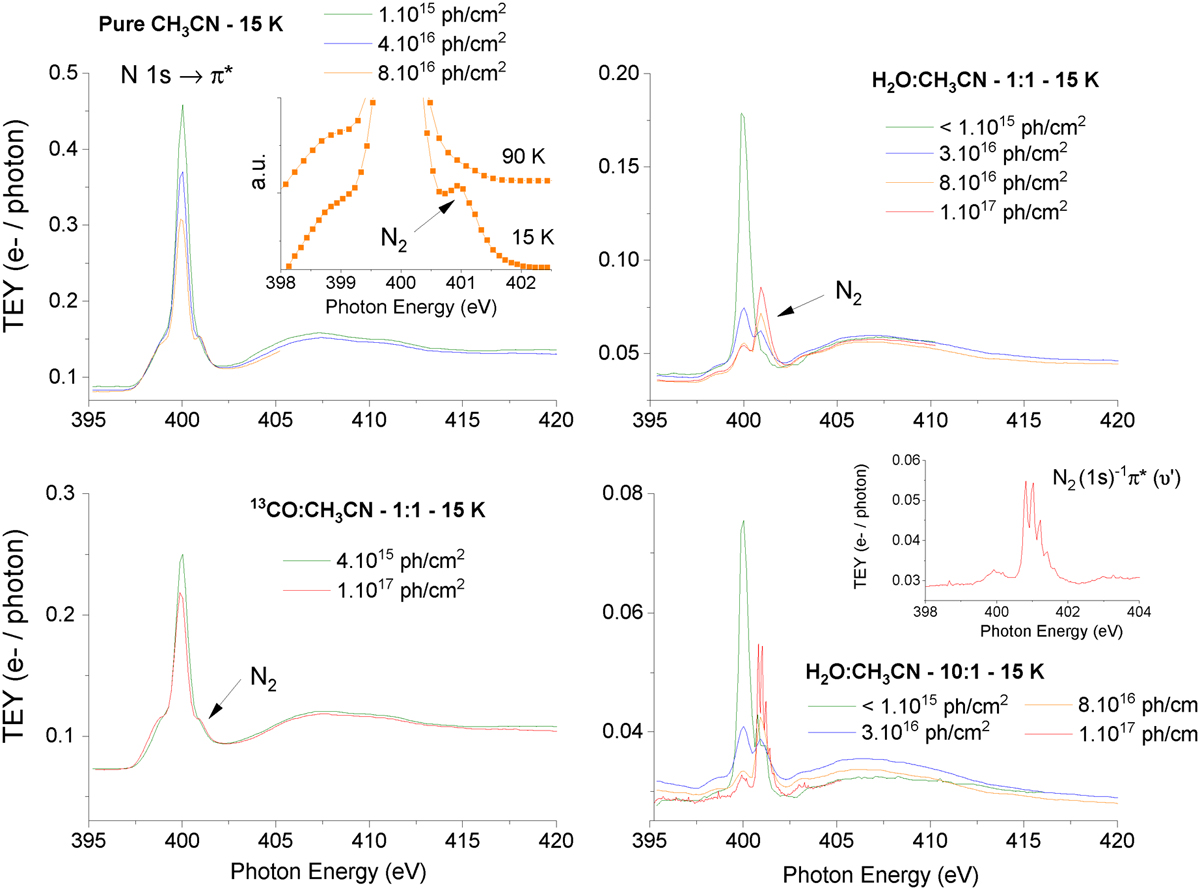
TEYs in the N K edge region of a pure CH3CN ice at 15 K (top left panel; the inset shows the region near the N 1s → π* resonance for an ice irradiated at 15 K and 90 K for the lower and upper curve, respectively; these curves are shifted vertically for more clarity), of a mixed H2O:CH3CN ice irradiated at 15 K with a dilution ratio of 1:1 and 10:1 (top and bottom right panel, respectively), and of a mixed 13CO:CH3CN ice irradiated at 15 K with a dilution ratio of 1:1 (bottom left panel). The photon fluence received by the ice before each TEY measurement is also displayed. The spectral width of the beam was set to 1.2 eV for all the TEY measurements, except for the one corresponding to the red curve in the bottom right panel, for a H2O:CH3CN ice having received a photon fluence of 1×10¹⁷ photons cm−2 and for which the spectral width was 90 meV. The inset in the bottom right panel zooms into the TEY measured on the H2O:CH3CN (10:1) ice for a photon fluence of 1017 photons cm−2, where the vibrational structure of the core hole state of N2 formed near the ice surface can be seen near 401 eV. The ices have a total thickness of ~100 ML.
Current usage metrics show cumulative count of Article Views (full-text article views including HTML views, PDF and ePub downloads, according to the available data) and Abstracts Views on Vision4Press platform.
Data correspond to usage on the plateform after 2015. The current usage metrics is available 48-96 hours after online publication and is updated daily on week days.
Initial download of the metrics may take a while.