Fig. A.1.
Download original image
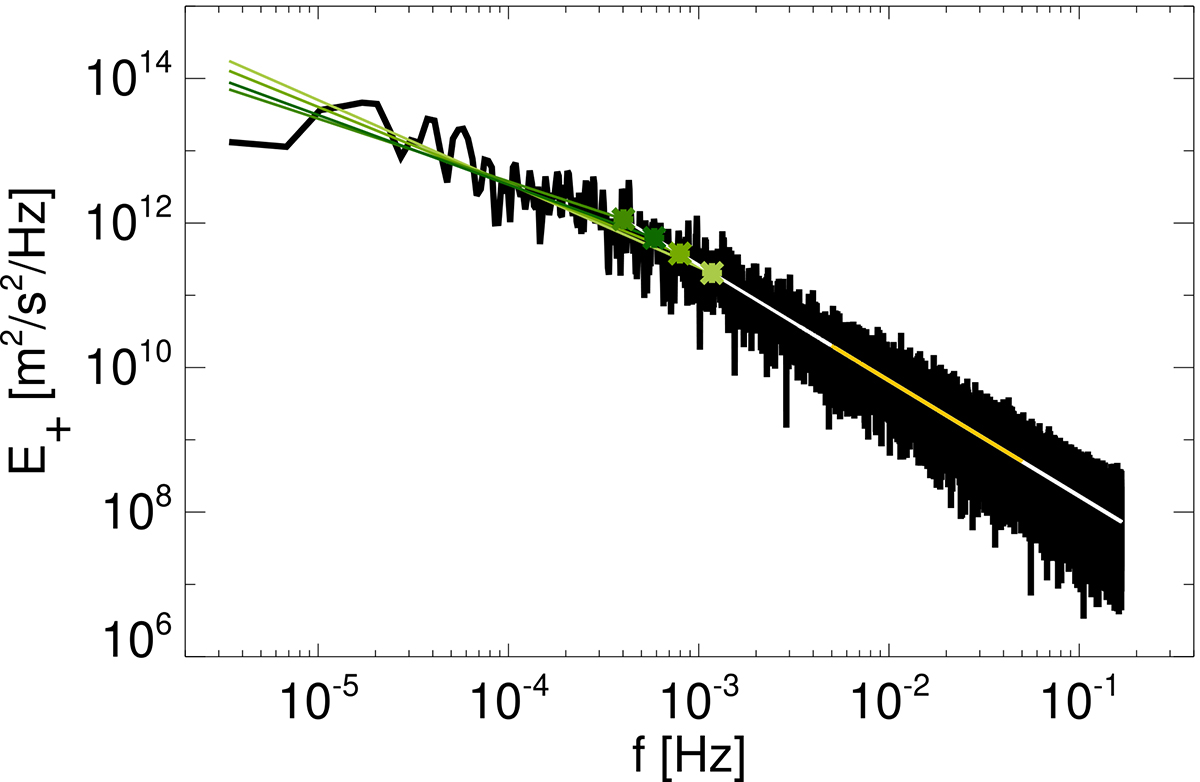
Power spectral density ![]() for the dominant Elsasser variable in the Alfvénic stream and estimates of the power density at the break position (symbols). The yellow line is the fit in the inertial range f ∈ [f1, f2] and the white line is an extension to higher and lower frequencies. We find the frequency break and its energy by fitting to a line
for the dominant Elsasser variable in the Alfvénic stream and estimates of the power density at the break position (symbols). The yellow line is the fit in the inertial range f ∈ [f1, f2] and the white line is an extension to higher and lower frequencies. We find the frequency break and its energy by fitting to a line ![]() in the range f < f0, with the constraint that the spectral density at the break,
in the range f < f0, with the constraint that the spectral density at the break, ![]() , must lie on the extension of the inertial range fit. To estimate the uncertainties we vary the fitting range of the second fit. We plot in green the resulting low-frequency fit (line) and the position of the break,
, must lie on the extension of the inertial range fit. To estimate the uncertainties we vary the fitting range of the second fit. We plot in green the resulting low-frequency fit (line) and the position of the break, ![]() (symbol), using darker color scale as the boundary of the fit moves to lower frequencies, f0 = f1/4, f1/8, f1/16, f1/32.
(symbol), using darker color scale as the boundary of the fit moves to lower frequencies, f0 = f1/4, f1/8, f1/16, f1/32.
Current usage metrics show cumulative count of Article Views (full-text article views including HTML views, PDF and ePub downloads, according to the available data) and Abstracts Views on Vision4Press platform.
Data correspond to usage on the plateform after 2015. The current usage metrics is available 48-96 hours after online publication and is updated daily on week days.
Initial download of the metrics may take a while.