| Issue |
A&A
Volume 696, April 2025
|
|
|---|---|---|
| Article Number | A192 | |
| Number of page(s) | 7 | |
| Section | The Sun and the Heliosphere | |
| DOI | https://doi.org/10.1051/0004-6361/202453094 | |
| Published online | 18 April 2025 | |
Switchbacks and their role in the turbulent cascade: Solar Orbiter observations
1
ASI – Italian Space Agency, Via del Politecnico snc, 00133 Rome, Italy
2
Dipartimento di Fisica, Università della Calabria, Rende, Italy
3
Space Research Institute, Austrian Academy of Sciences, Graz, Austria
4
National Institute for Astrophysics, Institute for Space Astrophysics and Planetology, Via del Fosso del Cavaliere 100, 00133 Rome, Italy
5
National Institute for Astrophysics, Astrophysical Observatory of Torino, Via Osservatorio 20, 10025 Pino Torinese, Italy
⋆ Corresponding author: This email address is being protected from spambots. You need JavaScript enabled to view it.
Received:
20
November
2024
Accepted:
5
March
2025
Abstract
Context. Magnetic switchbacks are large-amplitude magnetic field deflections of Alfvénic nature that are characterized by a high degree of correlation between the velocity and the magnetic field that are routinely detected in the inner heliosphere. Their timescales vary between hundreds of seconds to up to few hours, so that their role within the turbulent transfer of energy from large to small scales in the solar wind is a key question.
Aims. We investigate the contribution of switchbacks to the turbulence cascade in the magnetic and velocity fields. The considered interval was taken within the rarefaction region of the first stream of slow Afvénic wind observed by Solar Orbiter in the inner heliosphere.
Methods. The analysis was based on full-cadence measurements for the magnetic field vector from the fluxgate magnetometer MAG and reprocessed ion data sampled at a resolution of 4 s from the Proton and Alpha particle sensor (PAS) of the Solar Wind Analyser (SWA) suite. Alfvénicity, structure functions, and intermittency were evaluated to investigate the turbulence ands kinetic parameters to study the reaction of the plasma to the switchbacks.
Results. Switchbacks are observed as isolated structures or in well-localized patches that are generated by two (or more) interacting structures that cover a range from magnetohydrodynamic to kinetic scales. In this interval of the slow Afvénic wind, they mainly affect the magnetic cascade in the radial direction (which in this sample is almost parallel to the mean field direction) not only in terms of the energy content across the scales, but also in terms of the inhomogeneity (i.e., intermittency), which play a role in transferring magnetic and kinetic energies across scales. Moreover, switchbacks are characterized by a high anticorrelation between the magnetic and velocity field components, which implies that these structures are regions of a local alignment of v and b. Finally, no equipartition between kinetic and magnetic energy is found, which suggests that the emergence of magnetic structures is already well consolidated at about 0.6 au.
Conclusions. Our results in this interval of slow Afvénic wind suggest that an important role is played by switchbacks in the magnetic and velocity turbulent cascade in the flow direction. Moreover, by confirming and expanding previous features observed for a single case-study, our results support the idea that switchbacks strongly influence the surrounding plasma and play a different role on protons and alpha particles.
Key words: turbulence / Sun: heliosphere / solar wind
© The Authors 2025
 Open Access article, published by EDP Sciences, under the terms of the Creative Commons Attribution License (https://creativecommons.org/licenses/by/4.0), which permits unrestricted use, distribution, and reproduction in any medium, provided the original work is properly cited.
This article is published in open access under the Subscribe to Open model. This email address is being protected from spambots. You need JavaScript enabled to view it. to support open access publication.
1. Introduction
Magnetic field and plasma observations that are made in situ in the interplanetary space over a broad range of radial distances have reinforced the idea that the properties of the turbulent solar wind can vary with the radial distance from the Sun (Bruno et al. 2003; Perrone et al. 2019; Telloni et al. 2021) and also when different plasma parcels from different regions on the Sun are crossed (Perrone et al. 2022; Yardley et al. 2024). This implies that the solar wind changes its characteristics as a result of the dynamic evolution, but also keeps imprints that are closely connected to its source region. It is well assessed that during the solar wind propagation, turbulence passes from a more Alfvénic state close to the Sun toward states that are dominated by magnetic structures (Bruno et al. 2007) that emerge locally owing to the turbulent cascade. During its radial evolution from the Sun toward larger radial distances, the solar wind magnetic field has been observed to be characterized by sudden changes, foldings, and kinks by quite early spacecraft observations (McCracken et al. 1966; Borovsky 2016). Based on Parker Solar Probe (PSP) and Solar Orbiter measurements of the plasma in the inner heliosphere, it has more recently been possible to observe magnetic field reversals (the so-called switchbacks) over several timescales. They occur as isolated structures or in groups (Dudok de Wit et al. 2020; Laker et al. 2021; Pecora et al. 2022; Perrone et al. 2024). Rotations mainly affect the radial component of the magnetic field, while the magnitude of B remains almost constant. They are associated with jets of plasma (Bale et al. 2019; Kasper et al. 2019), and are of Alfvénic nature (Matteini et al. 2014; Johnston et al. 2022; Squire et al. 2022). Their origin is still under debate. Some observational evidence and numerical simulations associate the detection of switchbacks with a local evolution of the turbulent cascade (Squire et al. 2020; Shoda et al. 2021), while others claimed their formation in the solar atmosphere and that they are then advected by the wind through the heliosphere (Mozer et al. 2021; Telloni et al. 2022; Upendran & Tripathi 2022; Raouafi et al. 2023; Drake et al. 2021).
In a recent paper, Martinović et al. (2021) studied the turbulence properties within switchbacks and quiet regions based on a large number of intervals observed by PSP. They found that while the spectral properties did not differ inside and outside switchbacks, some kinetic properties and the level of intermittency changed significantly, so that they tend to regulate small-scale dynamics. We characterize the turbulence properties around switchbacks here and determine their contribution to the turbulent cascade, in the rarefaction region of a slow Alfvénic wind interval observed in the inner heliosphere. To do this, we use the second-order structure functions and the fourth-order moment (kurtosis), which is related to the intermittency, namely the degree of inhomogeneity of the distribution of magnetic energy as a function of the timescales. A kurtosis value that is higher than 3 suggests that magnetic energy is distributed in patches of large-amplitude spikes followed by voids. We also investigate the influence of the switchbacks (either isolated or in patches) on the kinetic plasma properties related to protons and alpha particles (Fedorov et al. 2021; Perrone et al. 2024).
2. Solar Orbiter observations
In July 2020, Solar Orbiter was embedded in a slow-wind stream at a radial distance of 0.64 au. This stream was characterized by a high level of Alfvénicity (D’Amicis et al. 2021). We focus on the portion of the rarefaction region of this slow Alfvénic wind between 22:12 UT on July 16 and 06:56 UT on July 17 to study the contribution of switchbacks to the turbulent cascade. Very recently, Perrone et al. (2024) have investigated the switchbacks in the same wind portion by restricting the study to an isolated magnetic deflection (∼7 minutes of data). They focused on its impacts on the kinetic properties of ions, namely protons and alpha particles. However, in the present analysis, we took all the switchbacks detected within the 9 hours of this slow Alfvénic interval into account and investigated the characteristic plasma parameters for protons and alpha particles inside and outside them. We also studied their role in the turbulent cascade.
We considered full-cadence measurements for the magnetic field vector (64 Hz) from the fluxgate magnetometer MAG (Horbury et al. 2020) and ion data at a resolution of 4 s from the Proton and Alpha particle sensor (PAS) of the Solar Wind Analyser (SWA) suite (Owen et al. 2020). In particular, the ion data were reprocessed by using the statistical technique of clustering on the full three-dimensional velocity distribution functions (VDFs) measured by PAS to separate the core and beam for both protons and alpha particles and to derive their moments (De Marco et al. 2023; Bruno et al. 2024).
2.1. Switchbacks
We detected several deflections in Br that were associated with strong fluctuations in the other two components while the magnitude was almost constant. These large deflections of the magnetic field, that is, switchbacks, can be isolated, as was the switchback described in detail by Perrone et al. (2024), or they can be found in patches. The switchbacks are associated with local enhancements of the radial component of the proton speed. However, strong fluctuations in the other two velocity components are also found (not shown).
To better identify switchbacks in the time series, we calculated the normalized deflection measure, z, as defined by Dudok de Wit et al. (2020),
![Mathematical equation: $$ \begin{aligned} z = \frac{1}{2} [1-\cos {\alpha }], \end{aligned} $$](/articles/aa/full_html/2025/04/aa53094-24/aa53094-24-eq1.gif) (1)
(1)
where α is the angle between the point-wise magnetic field, B, and a local average magnetic field, ⟨B⟩, evaluated on a running window of 6 hours. Panel a of Figure 1 shows the behavior of z in the analyzed stream. Several peaks of different intensity are recovered. As described by Perrone et al. (2024), we fixed the threshold for the switchback selection, z* = 0.18. This threshold, which corresponds to magnetic field deflections of 50° with respect to the locally averaged field, is shown in panel a as a dashed horizontal orange line. In addition to the isolated and strong (z > 0.5) peak that was recovered between 00:41 UT and 00:43 UT on July 17 (which was the subject of the study by Perrone et al. 2024), another two isolated magnetic deflections were detected, the first between 23:48 UT and 23:52 UT on July 16, and the second between 05:21 UT and 05:25 UT on July 17. These structures are highlighted in the figure by filled yellow bands and dashed vertical lines. Moreover, a group of switchbacks in a well-localized patch was observed between 03:30 UT and 04:20 UT on July 17 and is denoted by a filled green band and vertical dashed lines.
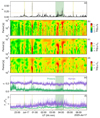 |
Fig. 1. (a) Dimensionless normalized deflection, z. The dashed horizontal orange line indicates z = 0.18, which we used as the threshold to select switchbacks in this interval (see Perrone et al. 2024, for details). (b) Logarithmic contour plots of the local intermittency measure (LIM) of the total magnetic fluctuations and of the total proton (c) and alpha (d) velocity fluctuations. The curved lines at each side of the plots indicate the cones of influence. (e) Non-Maxwellian parameter, ϵ, for protons (green) and alpha particles (violet). (f) Temperature anisotropy for protons (green) and alpha particles (violet) with respect to the background magnetic field, evaluated over the entire interval. The filled yellow (green) bands and dashed vertical lines denote isolated (a patch of) switchbacks. |
The switchbacks can affect the turbulent properties of the solar wind. To gain information about the details of turbulence and not only of its global properties, we studied the distribution in time and frequency of the magnetic and ion velocity field energies by using a local analysis of the fluctuations. Panels b–d of Figure 1 show the evolution of the local intermittency measure (LIM; Farge 1992) for the total magnetic (b), proton (c), and alpha particle (d) velocity field fluctuations, |𝒲ℱ(τ, t)|2 = ∑i|𝒲ℱi(τ, t)|2, with ℱ = B, Vp, Vα, and i = r, t, n, defined as (Farge 1992)
 (2)
(2)
where the brackets indicate a time average, and 𝒲ℱi(τ, t) are the Morlet wavelet coefficients for different timescales τ and time t (Torrence & Compo 1998),
![Mathematical equation: $$ \begin{aligned} \mathcal{W} _{\mathcal{F} _i}(\tau ,t) = \sum _{j=0}^{N-1} \mathcal{F} _i(t_j)\psi ^*\left[(t_j-t)/\tau \right]. \end{aligned} $$](/articles/aa/full_html/2025/04/aa53094-24/aa53094-24-eq3.gif) (3)
(3)
Here, ψ* is the conjugate of the wavelet function. The curved lines on each side of the plots represent the cone of influence, where the Morlet coefficients are affected by edge effects (Torrence & Compo 1998).
Panel b of Figure 1 shows the LIM for the total magnetic field fluctuations, IB. A nonuniform energy distribution is observed with the appearance of localized energetic events, which cover a broad range of scales. The events are easily recognized in red. These structures are strictly connected with the strong variations of the magnetic field components, and they indeed appear exactly at the location of the switchbacks. Thus, switchbacks play a role in transferring magnetic energy across scales, participating in the turbulent cascade. Moreover, the patch of switchbacks seems to consist of two stronger switchbacks at the edges and weaker fluctuations in the middle. Finally, other energetic events are recovered in the magnetic LIM (see, e.g., the events at the end of the interval). They might be related to coherent structures, such as current sheets and vortices (Greco et al. 2016; Perrone et al. 2020; Finelli et al. 2021; Perrone et al. 2023). Panels c and d of Figure 1 display the LIM for the total proton, IVp, and alpha particle, IVα, velocity fluctuations, respectively. We considered the moments of the total VDF (core plus beam) for both protons and alpha particles. As in the case of magnetic fluctuations, we recovered a nonuniform distribution of the energy with strong events that span almost all available frequencies. For the velocity fluctuations, the frequency range is limited to one decade, where the signal-to-noise ratio remains high enough to cover magnetohydrodynamic (MHD) scales. On the other hand, the magnetic fluctuations are affected by noise at shorter timescales, so that they span a range of timescale that reaches from MHD to ion kinetic scales. The most energetic events in panels c and d, namely in the proton and alpha velocity fields, are located at the switchback time of occurrence. This supports the idea that they play a role in the magnetic and velocity turbulent cascades. Within the patch of switchbacks, two main switchback structures can be recognized in the LIM signal that is relevant to the velocity fields.
Panels e and f of Figure 1 show the impact of switchbacks on the kinetic physics of the protons (green) and alpha particles (violet). In panel e we present the parameter ϵ, namely the non-Maxwellianity (Greco et al. 2012; Valentini et al. 2016), which indicates the deviation of the ion VDFs from the thermodynamic equilibrium. It is defined as
 (4)
(4)
where ns is the density for a species s, fs is the measured VDF, and gs is the associated Maxwellian distribution with the same density, temperature, and velocity as in the observed distribution. For a dimensionless quantity, the values of ϵ for the protons and alpha particles were multiplied by  , where VA is the background Alfvén speed (Valentini et al. 2016), calculated by using the total ion mass density (Marsch et al. 1982). The increase in ϵp is related to both isolated and grouped switchbacks, while alpha particles are not strongly affected by the magnetic deflections. This feature was also observed for the single switchback studied by Perrone et al. (2024). The alpha particles are only ∼3% of the proton population; thus, their signal is more affected by noise because of lower counts for their VDF. However, in general, ϵα > ϵp, as was also observed numerically (Valentini et al. 2016). This suggests a differential heating process caused by the alpha particle vortical motion, or a heating process that can affect this motion. Finally, ϵp increases significantly at the beginning of the interval. However, this is not related to the switchbacks (z ≃ 0), but some energetic magnetic events at about the ion characteristic scales are recovered (panel b). This feature is beyond the scope of this paper.
Another quantity we used to investigate the effect of switchbacks on the ion VDF is the temperature anisotropy, T⊥/T∥. The parallel and perpendicular directions are evaluated with respect to the background magnetic field over the entire interval (panel f in Figure 1) because the mean field direction is rather stable throughout the entire dataset (D’Amicis et al. 2021; Perrone et al. 2024). From the overall behavior of T⊥/T∥ for the protons (green) and alpha particles (violet), we deduced a parallel anisotropy (T∥ > T⊥). Indeed, we considered a total (core plus beam) VDF for ions, and thus, the secondary beam forces the VDF to be elongated in the parallel direction. However, it is clearly observed for protons that where isolated switchbacks appear, the direction of the temperature anisotropy changes, that is, T⊥ > T∥. This may be due to the local rotation of the field. In the case of the patch, we found two peaks for T⊥/T∥ > 1 that were located at the edges, while inside, T⊥/T∥ remains < 1. For the alpha particles, the local changes in the anisotropy sign are similar to those observed for protons (even though they are less clear because the fluctuations are stronger), but the general behavior is different. Even if T⊥/T∥ is lower than 1 at the beginning and end of the interval, the alpha VDF is more isotropic in the middle of the period.
2.2. Statistical correlations
Within the analyzed interval, we investigated the correlations between the z values and the plasma quantities to characterize the kinetic properties of the plasma during the occurrence of the magnetic field deflections in a more statistical sense. This extends the results presented by Perrone et al. (2024), who used a single switchback as a case study. Figure 2 shows the scatter plots of z versus density (a and f), radial velocity (b and g), temperature (c and h), non-Maxwellianity (d and i), and temperature anisotropy (e and j) for the protons (top) and alpha particles (bottom). The orange dots show the values of z that are above the selected threshold z*. In the panels in Figure 2, gray dots (values below z*) present a high degree of dispersion. The orange dots are characterized by a certain linear correlation for most of the plasma quantities. This is based on a smaller number of points for z > z*, but a certain degree of correlation can be recognized in Figure 2.
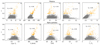 |
Fig. 2. Scatter plots of the z parameter as a function of density (a and f), radial velocity (b and g), temperature (c and h), ϵ (d and i), and temperature anisotropy (e and j) for protons (top) and alpha particles (bottom). The orange dots show the values over the threshold z* for which the Pearson correlation coefficient, Rp, is also provided. |
For the orange dots (i.e., for values of z above the threshold), we provide the Pearson correlation coefficient, Rp, which gives a measure of the linearity of the relation between z and the ion quantities in the figure. The linear correlation at the 95% degree of confidence is consistent with |Rp|> Rp*, where  (Borovsky et al. 1998, and references therein), and N = 104 is the number of data points above the threshold. z and the radial component of the velocity are clearly linearly correlated for the protons (panel b) and alpha particles (panel g). This is consistent with the Alfvénic nature of the switchbacks, that is, the deflection of the magnetic field occurs simultaneously with a sudden increase in the velocity. Panels a and f suggest a certain correlation also between z and ion density, which suggests wave activity (Stix 1992). The correlation between density and magnetic field variations can indeed be used to identify wave modes, such as fast magnetosonic waves or slow modes. Chaston et al. (2020) applied this method to PSP measurements during the first encounter. By employing wave decomposition under MHD approximation, they concluded that the predominant wave mode corresponds to shear Alfvén waves. Moreover, panel h of Figure 2 gives an indication of a certain correlation between z and alpha particle temperature, but not with proton temperature (panel c), suggesting that magnetic field deflections play a role in preferentially heating heavy ions, namely alpha particles. On the other hand, an opposite behavior is found between z and the non-Maxwellian parameter, ϵ (d and i). In particular, magnetic deflections seem to play a role in the deformation of the proton VDF, but not for alpha particles. This feature confirms and expands the results discussed by Perrone et al. (2024). The kinetic properties related to switchbacks we observed in this study are consistent with the detailed analysis performed in the case study. This suggests a typical behavior of the plasma when switchbacks are present. Finally, a clear linear correlation is recovered between z and the proton temperature anisotropy (e), with a change in the sign of T⊥/T∥ when strong magnetic deflections are observed. For alpha particles, instead, the correlation is weak and the VDF is more isotropic (j). These results suggest that switchbacks can affect the shape of the proton VDF (see ϵ and T⊥/T∥), while they can induce some mechanisms for preferentially heating heavy ions (see the total temperature). The noise in the alpha-particle signal needs to be taken into account.
2.3. Alfvénic content
Because switchbacks are characterized by a high degree of correlation between the radial components of the magnetic and the velocity field, we calculated the Alfvénicity by means of the Elsässer variables (Elsasser 1950),
 (5)
(5)
where v and b are the perturbations of the velocity and the magnetic field, respectively, and b is expressed in Alfvén units, (b = B/(4πρ)1/2, where ρ is the mass density). The Elsässer variables allowed us to separate the outward from the inward contribution in the solar wind Alfvénic fluctuations, where δv = ∓δb is expected: For a magnetic field directed outward with respect to the Sun, a negative correlation between velocity and magnetic fluctuations indicates a mode propagating away from the Sun, while a positive correlation represents a mode directed toward the Sun (Barnes & Hollweg 1974). When the magnetic field is directed toward the Sun, the correlation sign reverses with respect to the previous cases (Roberts et al. 1987a,b). In this way, z+ and z− always refer to outward and inward modes, respectively. Figure 3 shows for three different timescales, namely 10 (blue), 50 (red), and 100 (green) τ/τcp, where τcp is the proton cyclotron period, the normalized cross helicity, σC (a), defined as
 (6)
(6)
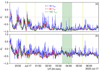 |
Fig. 3. Time evolution of the (a) normalized cross helicity, σC, and (b) the normalized residual energy, σR, computed at three different values of the timescale, τ/τcp, namely 10 (blue), 50 (red), and 100 (green). The filled yellow (green) bands and dashed vertical lines denote isolated (patch of) switchbacks, as in Figure 1. |
where e+ and e− are the energies per unit mass associated with the Elsässer variables, namely the power spectra (Tu et al. 1984; Roberts et al. 1987b; Tu & Marsch 1995; Lucek & Balogh 1998), and the normalized residual energy, σR (panel b), defined as
 (7)
(7)
where ev and eb are the kinetic and magnetic energy per unit mass of the fluctuations, respectively. Because they are normalized quantities, σC and σR vary from −1 and +1, and they indicate the predominance of inward modes with respect to outward modes and the excess of magnetic or velocity fluctuation energies, respectively. An ideal Alfvén wave satisfies the following conditions: σC = ±1 and σR = 0, that is, equipartition between kinetic and magnetic energy (Bruno & Carbone 2013).
Panel a of Figure 3 shows the behavior of σC. It suggests that switchbacks, regardless of whether they are isolated or grouped (yellow and green bands, respectively), are characterized by values of σC very close to −1 at the three timescales we selected (from almost 2 minutes up to fraction of a hour). Therefore, we find that the magnetic and velocity field components within the switchbacks are highly anticorrelated and thus are an indication of Alfvénicity. At the borders of the switchbacks we selected in our interval, the degree of correlations between magnetic and velocity fluctuations decreases (i.e., |σC|< 1), probably because the radial magnetic field component varies rapidly. This is particularly true at timescales of ∼10 τcp, and it implies that switchbacks are regions of local alignment of v and b.
On the other hand, panel b Figure 3 shows the behavior of σR, where no equipartition between kinetic and magnetic energy is observed, as is instead expected for Alfvén waves. When a switchback occurs, σR < 1, and on average, an excess of magnetic energy at long timescales is observed within the entire interval, except at the very beginning. This result indicates that the emergence of magnetic structures is already well consolidated at ∼0.6 au (Bruno et al. 2007) and that switchbacks are characterized by this imbalance. No significant differences were found among different timescales and during switchbacks because the three curves in Figure 3 tend to almost overlap within the highlighted portions of the signal. Thus, this characteristic is persistent at all scales.
2.4. Structure functions and intermittency
To study the role played by switchbacks within the turbulent cascade, we used the structure functions Sq(τ) of the magnetic field, which are defined via the magnetic field increments at a certain timescale τ,
 (8)
(8)
with i = r, t, n, and the brackets indicate the time average. In order to infer the contribution of the magnetic deflections to the turbulent transfer of magnetic energy, we modified the original dataset by removing magnetic field fluctuations associated with switchbacks that showed values of z higher than the threshold we selected. The new dataset was interpolated. The switchbacks represent ∼1.3% of the entire time series. Possible spurious effects due to the interpolation procedure are therefore negligible. It is worth pointing out that removing the switchbacks from the dataset is the only approach that can be used to study the difference in the turbulent properties with or without these magnetic deflections in the interval. The second-order structure functions as well as intermittency cannot be computed within each single switchback because in order to have a statistical meaning, these quantities must be evaluated over intervals of at least a few correlation lengths (the correlation length is about 10 minutes).
Figure 4 shows the second-order structure functions for the radial (blue line), tangential (red), and normal (green) components of the magnetic field. The structure functions calculated for the three components of the interpolated magnetic field (ns) are also shown in Figure 4 by dashed lines. While structure functions do not exhibit significant changes for the tangential and normal components, a significant variation can be detected in the radial component (the y axis is in log scale). This implies that even though large-amplitude magnetic field deflections represent almost 1% of the dataset, their contribution to the turbulent transfer of the magnetic energy is non-negligible. This mainly affects the radial field component.
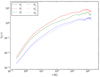 |
Fig. 4. Second-order structure functions for the radial (blue), tangential (red), and normal (green) components of the magnetic field. The dashed curves represent second-order structure functions calculated over the interpolated region after removing switchbacks. |
The differences between the original and the switchback-cleaned datasets can be further enhanced by computing the fourth-order moment of the magnetic field increments, that is, the flatness (or kurtosis) Fi(τ). This measure also provides information about the intermittency level of the magnetic field fluctuations (Carbone et al. 2004; Bruno & Carbone 2016),
 (9)
(9)
where S2i(τ) and S4i(τ) are the second- and fourth-order structure functions, respectively. The flatness calculated for the radial (blue line), tangential (red), and normal (green) components of the magnetic field is reported in Figure 5. The dashed lines refer to Fi(τ) for the three components of the interpolated magnetic field (ns). The Gaussian level of 3 is indicated by the horizontal dash-dotted line. We highlight that the radial and normal component fourth-order moments are highly sensitive to large-amplitude magnetic deflections. Not only is the amplitude of the flatness lower when it is computed on the switchback-cleaned dataset, but the increase rate in Fi(τ) as a function of the timescale changes as well. In the original dataset, Fr(τ) and Fn(τ) increase more rapidly from large toward shorter timescales. This implies a higher intermittency level in the turbulent cascade in the presence of switchbacks. No significant changes are observed for Ft(τ). In addition, the fits calculated in the range of timescales (6 − 90)τcp show that the level of intermittency is in general greater for the tangential and normal components than for the radial component. This implies a higher level of inhomogeneity of the turbulent cascade in the components perpendicular to the radial direction, which is almost aligned with the mean field direction.
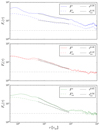 |
Fig. 5. Flatness of the increments as a function of the timescale (τ) computed for the (a) radial, (b) tangential, and (c) normal components of the magnetic field. The dashed lines indicate the flatness calculated for the three components of the interpolated magnetic field (ns). The horizontal dash-dotted line corresponds to the Gaussian level of 3. |
3. Summary
We have characterized turbulence properties that result from switchbacks and their contribution to the turbulent cascade in the rarefaction region of a slow Alfvénic stream observed by Solar Orbiter at 0.64 au. Switchbacks are detected as isolated structures, such as the structure described in detail by Perrone et al. (2024), or in well-localized patches, which are generated by two (or more) close switchbacks that can interact and produce strong fluctuations between them at smaller scales. In general, switchbacks appear as localized energetic events, and they span a broad range of timescales in magnetic and velocity fields. They cover a range from MHD to kinetic scales for the magnetic fluctuations. Because the resolution of the particle measurements is limited (i.e. 4 s), the available frequency range for the velocity fluctuations only covers MHD scales.
We selected switchbacks by taking into account the threshold in the normalized deflection measure that clearly separates two peaks in its PDF (Perrone et al. 2024). The identification of a suitable threshold in the switchback selection is crucial for a correct interpretation of the statistical correlations. By expanding the results described by Perrone et al. (2024) to a statistical analysis, we found that switchbacks appear to be characterized, as expected, by a clear correlation with spikes in the ion speed, which is due to their Alfvénic nature. Regardless of whether they are isolated or grouped, the MHD region is characterized by a high anticorrelation between the magnetic and velocity field components. However, kinetic and magnetic energy are not equipartitioned, as expected in case of Alfvén waves. This suggests that the emergence of magnetic structures (Bruno et al. 2007) is already well consolidated at 0.64 au. A good degree of correlation was also found with the densities of protons and alpha particles. This feature suggests wave activity (Stix 1992). However, the most interesting features are observed in the quantities related to the heating and deformation of the ion VDFs. By confirming the results for a single case study (Perrone et al. 2024), we found that protons and alpha particles react differently to the switchbacks. Proton VDFs appear to be highly deformed during strong magnetic deflections (high values of ϵp and anisotropic temperature). Alpha particles are more isotropic within these magnetic structures. However, we found an indication of a certain correlation with increasing alpha particle temperature. Therefore, the statistical correlations suggest that switchbacks can play a role in the preferential heating of heavy ions.
Finally, although the switchbacks in this interval represent only 1.3% of the entire time series, they contribute strongly to the turbulent cascade. The second-order structure function of the radial component significantly changes when it is calculated for the original dataset and for the switchback-cleaned dataset, which implies that these deflections carry a non-negligible fraction of magnetic energy in the cascade. When we computed the fourth-order moment, which quantifies the degree of intermittency in the turbulent cascade, the switchbacks not only maintained a far higher flatness than the Gaussian threshold of 3, but the increase rate of this quantity as a function of the timescale was higher than when we removed large-amplitude magnetic field deflections. This is particularly clear again in the radial direction, as expected. Thus, the degree of inhomogeneity of the turbulent magnetic energy transfer is strongly influenced by the switchbacks. More solar wind samples need to be investigated in order to draw a more robust conclusion of the switchback role in the turbulent cascade. Their effect on heavy ions likewise needs to be confirmed.
Acknowledgments
Solar Orbiter is a space mission of international collaboration between ESA and NASA, operated by ESA. Solar Orbiter SWA data are derived from scientific sensors that have been designed and created, and are operated under funding provided in numerous contracts from the UK Space Agency (UKSA), the UK Science and Technology Facilities Council (STFC), the Agenzia Spaziale Italiana (ASI), the Centre National DEtudes Spatiales (CNES, France), the Centre national d’études spatiales (CNRS, France), the Czech contribution to the ESA PRODEX programme and NASA. DP acknowledges the support of the PRIN 2022 project ‘2022KL38BK – The ULtimate fate of TuRbulence from space to laboratory plAsmas (ULTRA)’ (Master CUP B53D23004850006; CUP F53D23001220008) by the Italian Ministry of University and Research, ‘Finanziato dall’Unione europea – Next Generation EU’ PIANO NAZIONALE DI RIPRESA E RESILIENZA (PNRR) Missione 4 “Istruzione e Ricerca” – Componente C2 Investimento 1.1, ‘Fondo per il Programma Nazionale di Ricerca e Progetti di Rilevante Interesse Nazionale (PRIN)’ Settore PE09. SP and FC acknowledge the project ‘Data-based predictions of solar energetic particle arrival to the Earth: ensuring space data and technology integrity from hazardous solar activity events’ (CUP H53D23011020001) ‘Finanziato dall’Unione europea – Next Generation EU’ PIANO NAZIONALE DI RIPRESA E RESILIENZA (PNRR) Missione 4 “Istruzione e Ricerca” – Componente C2 Investimento 1.1, ‘Fondo per il Programma Nazionale di Ricerca e Progetti di Rilevante Interesse Nazionale (PRIN)’ Settore PE09. SP further acknowledges the Space It Up project funded by the Italian Space Agency, ASI, and the Ministry of University and Research, MUR, under contract n. 2024-5-E.0 – CUP n. I53D24000060005. DP, AS and RDA would like to acknowledge the International Space Science Institute (ISSI) for its support of the team #550 ‘Solar sources and evolution of the Alfvénic slow wind’ dedicated in part to the analysis of Solar Orbiter data.
References
- Bale, S. D., Badman, S. T., Bonnell, J. W., et al. 2019, Nature, 576, 237 [NASA ADS] [CrossRef] [Google Scholar]
- Barnes, A., & Hollweg, J. V. 1974, J. Geophys. Res., 79, 2302 [NASA ADS] [CrossRef] [Google Scholar]
- Borovsky, J. E. 2016, J. Geophys. Res.: Space Phys., 121, 5055 [Google Scholar]
- Borovsky, J. E., Thomsen, M. F., & Elphic, R. C. 1998, J. Geophys. Res., 103, 17617 [Google Scholar]
- Bruno, R., & Carbone, V. 2013, Liv. Rev. Sol. Phys., 10, 2 [Google Scholar]
- Bruno, R., & Carbone, V. 2016, Turbulence in the Solar Wind: Lecture Notes in Physics (Switzerland: Springer International Publishing) [CrossRef] [Google Scholar]
- Bruno, R., Carbone, V., Sorriso-Valvo, L., & Bavassano, B. 2003, J. Geophys. Res.: Space Phys., 108, 1130 [NASA ADS] [CrossRef] [Google Scholar]
- Bruno, R., D’Amicis, R., Bavassano, B., Carbone, V., & Sorriso-Valvo, L. 2007, Ann. Geophys., 25, 1913 [NASA ADS] [CrossRef] [Google Scholar]
- Bruno, R., Marco, R. D., D’Amicis, R., et al. 2024, ApJ, 969, 106 [NASA ADS] [CrossRef] [Google Scholar]
- Carbone, V., Bruno, R., Sorriso-Valvo, L., & Lepreti, F. 2004, Planet. Space Sci., 52, 953 [CrossRef] [Google Scholar]
- Chaston, C. C., Bonnell, J. W., Bale, S. D., et al. 2020, ApJS, 246, 71 [Google Scholar]
- D’Amicis, R., Bruno, R., Panasenco, O., et al. 2021, A&A, 656, A21 [NASA ADS] [CrossRef] [EDP Sciences] [Google Scholar]
- De Marco, R., Bruno, R., Jagarlamudi, V. K., et al. 2023, A&A, 669, A108 [NASA ADS] [CrossRef] [EDP Sciences] [Google Scholar]
- Drake, J. F., Agapitov, O., Swisdak, M., et al. 2021, A&A, 650, A2 [EDP Sciences] [Google Scholar]
- Dudok de Wit, T., Krasnoselskikh, V. V., Bale, S. D., et al. 2020, ApJS, 246, 39 [Google Scholar]
- Elsasser, W. M. 1950, Phys. Rev., 79, 183 [Google Scholar]
- Farge, M. 1992, Annu. Rev. Fluid Mech., 24, 395 [Google Scholar]
- Fedorov, A., Louarn, P., Owen, C. J., et al. 2021, A&A, 656, A40 [NASA ADS] [CrossRef] [EDP Sciences] [Google Scholar]
- Finelli, F., Perri, S., Sisti, M., & Califano, F. 2021, A&A, 656, A43 [NASA ADS] [CrossRef] [EDP Sciences] [Google Scholar]
- Greco, A., Valentini, F., Servidio, S., & Matthaeus, W. H. 2012, Phys. Rev. E, 86, 066405 [NASA ADS] [CrossRef] [Google Scholar]
- Greco, A., Perri, S., Servidio, S., Yordanova, E., & Veltri, P. 2016, ApJ, 823, L39 [CrossRef] [Google Scholar]
- Horbury, T. S., O’Brien, H., Carrasco Blazquez, I., et al. 2020, A&A, 642, A9 [NASA ADS] [CrossRef] [EDP Sciences] [Google Scholar]
- Johnston, Z., Squire, J., Mallet, A., & Meyrand, R. 2022, Phys. Plasmas, 29, 072902 [NASA ADS] [CrossRef] [Google Scholar]
- Kasper, J. C., Bale, S. D., Belcher, J. W., et al. 2019, Nature, 576, 228 [Google Scholar]
- Laker, R., Horbury, T. S., Bale, S. D., et al. 2021, A&A, 650, A1 [EDP Sciences] [Google Scholar]
- Lucek, E. A., & Balogh, A. 1998, ApJ, 507, 984 [NASA ADS] [CrossRef] [Google Scholar]
- Marsch, E., Rosenbauer, H., Schwenn, R., Muehlhaeuser, K. H., & Neubauer, F. M. 1982, J. Geophys. Res., 87, 35 [Google Scholar]
- Martinović, M. M., Klein, K. G., Huang, J., et al. 2021, ApJ, 912, 28 [CrossRef] [Google Scholar]
- Matteini, L., Horbury, T. S., Neugebauer, M., & Goldstein, B. E. 2014, Geophys. Res. Lett., 41, 259 [Google Scholar]
- McCracken, K. G., Rao, U. R., & Bukata, R. P. 1966, Phys. Rev. Lett., 17, 928 [Google Scholar]
- Mozer, F. S., Bale, S. D., Bonnell, J. W., et al. 2021, ApJ, 919, 60 [NASA ADS] [CrossRef] [Google Scholar]
- Owen, C. J., Bruno, R., Livi, S., et al. 2020, A&A, 642, A16 [EDP Sciences] [Google Scholar]
- Pecora, F., Matthaeus, W. H., Primavera, L., et al. 2022, ApJ, 929, L10 [NASA ADS] [CrossRef] [Google Scholar]
- Perrone, D., Stansby, D., Horbury, T. S., & Matteini, L. 2019, MNRAS, 488, 2380 [Google Scholar]
- Perrone, D., Bruno, R., D’Amicis, R., et al. 2020, ApJ, 905, 142 [NASA ADS] [CrossRef] [Google Scholar]
- Perrone, D., Perri, S., Bruno, R., et al. 2022, A&A, 668, A189 [NASA ADS] [CrossRef] [EDP Sciences] [Google Scholar]
- Perrone, D., Settino, A., De Marco, R., D’Amicis, R., & Perri, S. 2023, Front. Astron. Space Sci., 10, 1250219 [Google Scholar]
- Perrone, D., Settino, A., Perri, S., et al. 2024, ApJ, 973, 171 [Google Scholar]
- Raouafi, N. E., Matteini, L., Squire, J., et al. 2023, Space Sci. Rev., 219, 8 [NASA ADS] [CrossRef] [Google Scholar]
- Roberts, D. A., Goldstein, M. L., Klein, L. W., & Matthaeus, W. H. 1987a, J. Geophys. Res., 92, 12023 [Google Scholar]
- Roberts, D. A., Klein, L. W., Goldstein, M. L., & Matthaeus, W. H. 1987b, J. Geophys. Res., 92, 11021 [Google Scholar]
- Shoda, M., Chandran, B. D. G., & Cranmer, S. R. 2021, ApJ, 915, 52 [CrossRef] [Google Scholar]
- Squire, J., Chandran, B. D. G., & Meyrand, R. 2020, ApJ, 891, L2 [Google Scholar]
- Squire, J., Johnston, Z., Mallet, A., & Meyrand, R. 2022, Phys. Plasmas, 29, 112903 [CrossRef] [Google Scholar]
- Stix, T. H. 1992, Waves in Plasmas (College Park: American Institute of Physics) [Google Scholar]
- Telloni, D., Sorriso-Valvo, L., Woodham, L. D., et al. 2021, ApJ, 912, L21 [NASA ADS] [CrossRef] [Google Scholar]
- Telloni, D., Zank, G. P., Stangalini, M., et al. 2022, ApJ, 936, L25 [NASA ADS] [CrossRef] [Google Scholar]
- Torrence, C., & Compo, G. P. 1998, Bull. Am. Meteorol. Soc., 79, 61 [Google Scholar]
- Tu, C. Y., & Marsch, E. 1995, Space Sci. Rev., 73, 1 [Google Scholar]
- Tu, C. Y., Pu, Z. Y., & Wei, F. S. 1984, J. Geophys. Res., 89, 9695 [NASA ADS] [CrossRef] [Google Scholar]
- Upendran, V., & Tripathi, D. 2022, ApJ, 926, 138 [NASA ADS] [CrossRef] [Google Scholar]
- Valentini, F., Perrone, D., Stabile, S., et al. 2016, New J. Phys., 18, 125001 [NASA ADS] [CrossRef] [Google Scholar]
- Yardley, S. L., Brooks, D. H., D’Amicis, R., et al. 2024, Nat. Astron., 8, 953 [NASA ADS] [CrossRef] [Google Scholar]
All Figures
|
Fig. 1. (a) Dimensionless normalized deflection, z. The dashed horizontal orange line indicates z = 0.18, which we used as the threshold to select switchbacks in this interval (see Perrone et al. 2024, for details). (b) Logarithmic contour plots of the local intermittency measure (LIM) of the total magnetic fluctuations and of the total proton (c) and alpha (d) velocity fluctuations. The curved lines at each side of the plots indicate the cones of influence. (e) Non-Maxwellian parameter, ϵ, for protons (green) and alpha particles (violet). (f) Temperature anisotropy for protons (green) and alpha particles (violet) with respect to the background magnetic field, evaluated over the entire interval. The filled yellow (green) bands and dashed vertical lines denote isolated (a patch of) switchbacks. |
| In the text | |
|
Fig. 2. Scatter plots of the z parameter as a function of density (a and f), radial velocity (b and g), temperature (c and h), ϵ (d and i), and temperature anisotropy (e and j) for protons (top) and alpha particles (bottom). The orange dots show the values over the threshold z* for which the Pearson correlation coefficient, Rp, is also provided. |
| In the text | |
|
Fig. 3. Time evolution of the (a) normalized cross helicity, σC, and (b) the normalized residual energy, σR, computed at three different values of the timescale, τ/τcp, namely 10 (blue), 50 (red), and 100 (green). The filled yellow (green) bands and dashed vertical lines denote isolated (patch of) switchbacks, as in Figure 1. |
| In the text | |
|
Fig. 4. Second-order structure functions for the radial (blue), tangential (red), and normal (green) components of the magnetic field. The dashed curves represent second-order structure functions calculated over the interpolated region after removing switchbacks. |
| In the text | |
|
Fig. 5. Flatness of the increments as a function of the timescale (τ) computed for the (a) radial, (b) tangential, and (c) normal components of the magnetic field. The dashed lines indicate the flatness calculated for the three components of the interpolated magnetic field (ns). The horizontal dash-dotted line corresponds to the Gaussian level of 3. |
| In the text | |
Current usage metrics show cumulative count of Article Views (full-text article views including HTML views, PDF and ePub downloads, according to the available data) and Abstracts Views on Vision4Press platform.
Data correspond to usage on the plateform after 2015. The current usage metrics is available 48-96 hours after online publication and is updated daily on week days.
Initial download of the metrics may take a while.