Open Access
Fig. 3.
Download original image
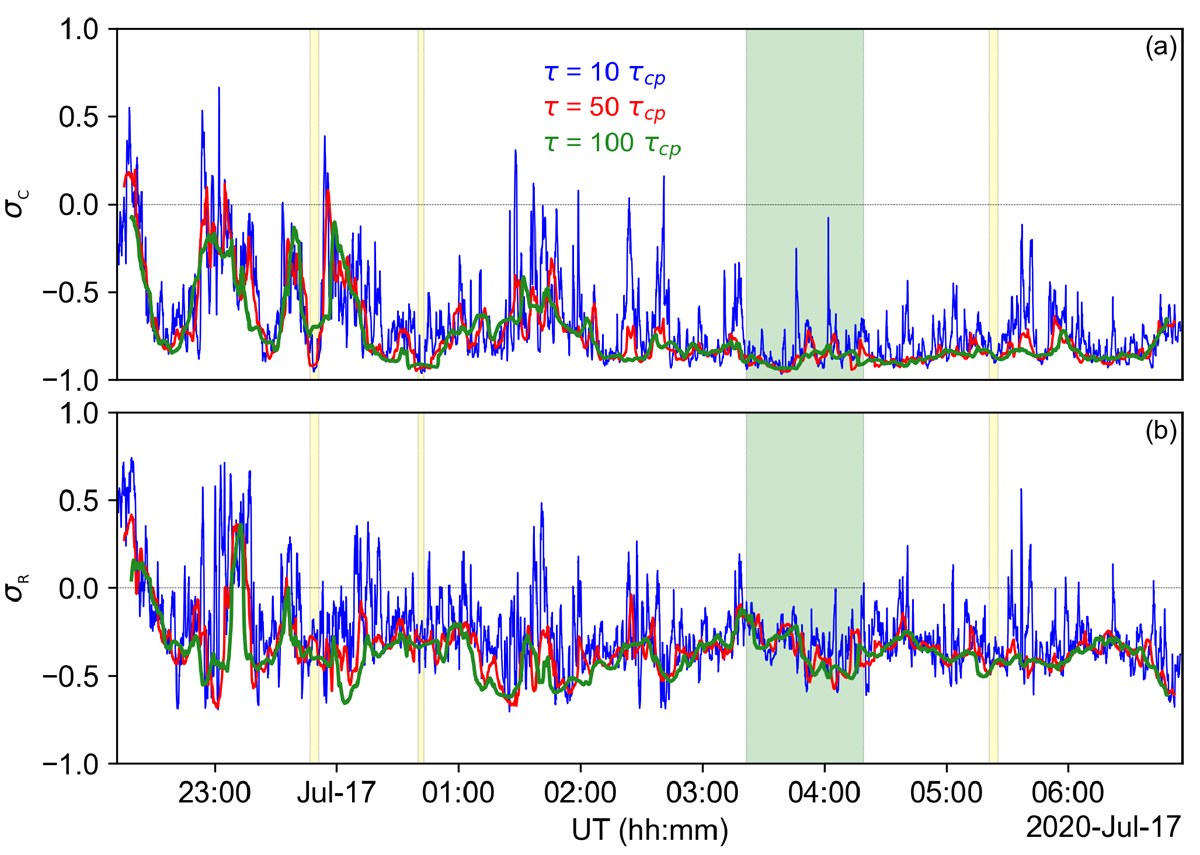
Time evolution of the (a) normalized cross helicity, σC, and (b) the normalized residual energy, σR, computed at three different values of the timescale, τ/τcp, namely 10 (blue), 50 (red), and 100 (green). The filled yellow (green) bands and dashed vertical lines denote isolated (patch of) switchbacks, as in Figure 1.
Current usage metrics show cumulative count of Article Views (full-text article views including HTML views, PDF and ePub downloads, according to the available data) and Abstracts Views on Vision4Press platform.
Data correspond to usage on the plateform after 2015. The current usage metrics is available 48-96 hours after online publication and is updated daily on week days.
Initial download of the metrics may take a while.