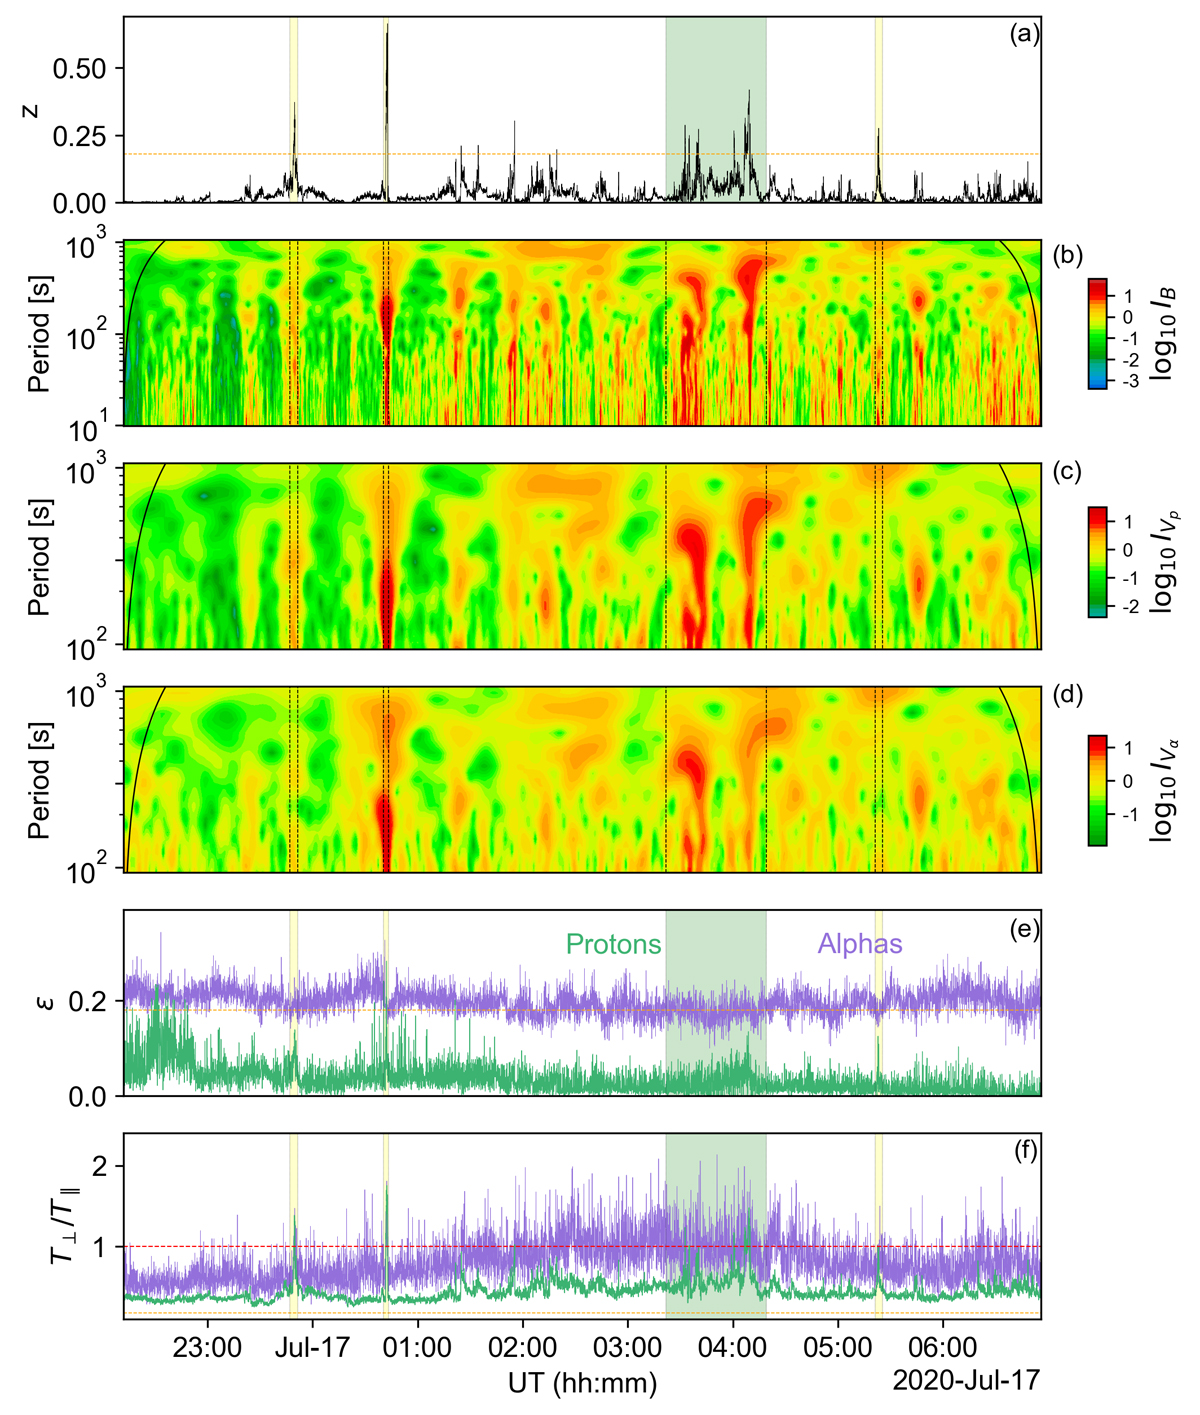
Fig. 1.
Download original image
(a) Dimensionless normalized deflection, z. The dashed horizontal orange line indicates z = 0.18, which we used as the threshold to select switchbacks in this interval (see Perrone et al. 2024, for details). (b) Logarithmic contour plots of the local intermittency measure (LIM) of the total magnetic fluctuations and of the total proton (c) and alpha (d) velocity fluctuations. The curved lines at each side of the plots indicate the cones of influence. (e) Non-Maxwellian parameter, ϵ, for protons (green) and alpha particles (violet). (f) Temperature anisotropy for protons (green) and alpha particles (violet) with respect to the background magnetic field, evaluated over the entire interval. The filled yellow (green) bands and dashed vertical lines denote isolated (a patch of) switchbacks.
Current usage metrics show cumulative count of Article Views (full-text article views including HTML views, PDF and ePub downloads, according to the available data) and Abstracts Views on Vision4Press platform.
Data correspond to usage on the plateform after 2015. The current usage metrics is available 48-96 hours after online publication and is updated daily on week days.
Initial download of the metrics may take a while.