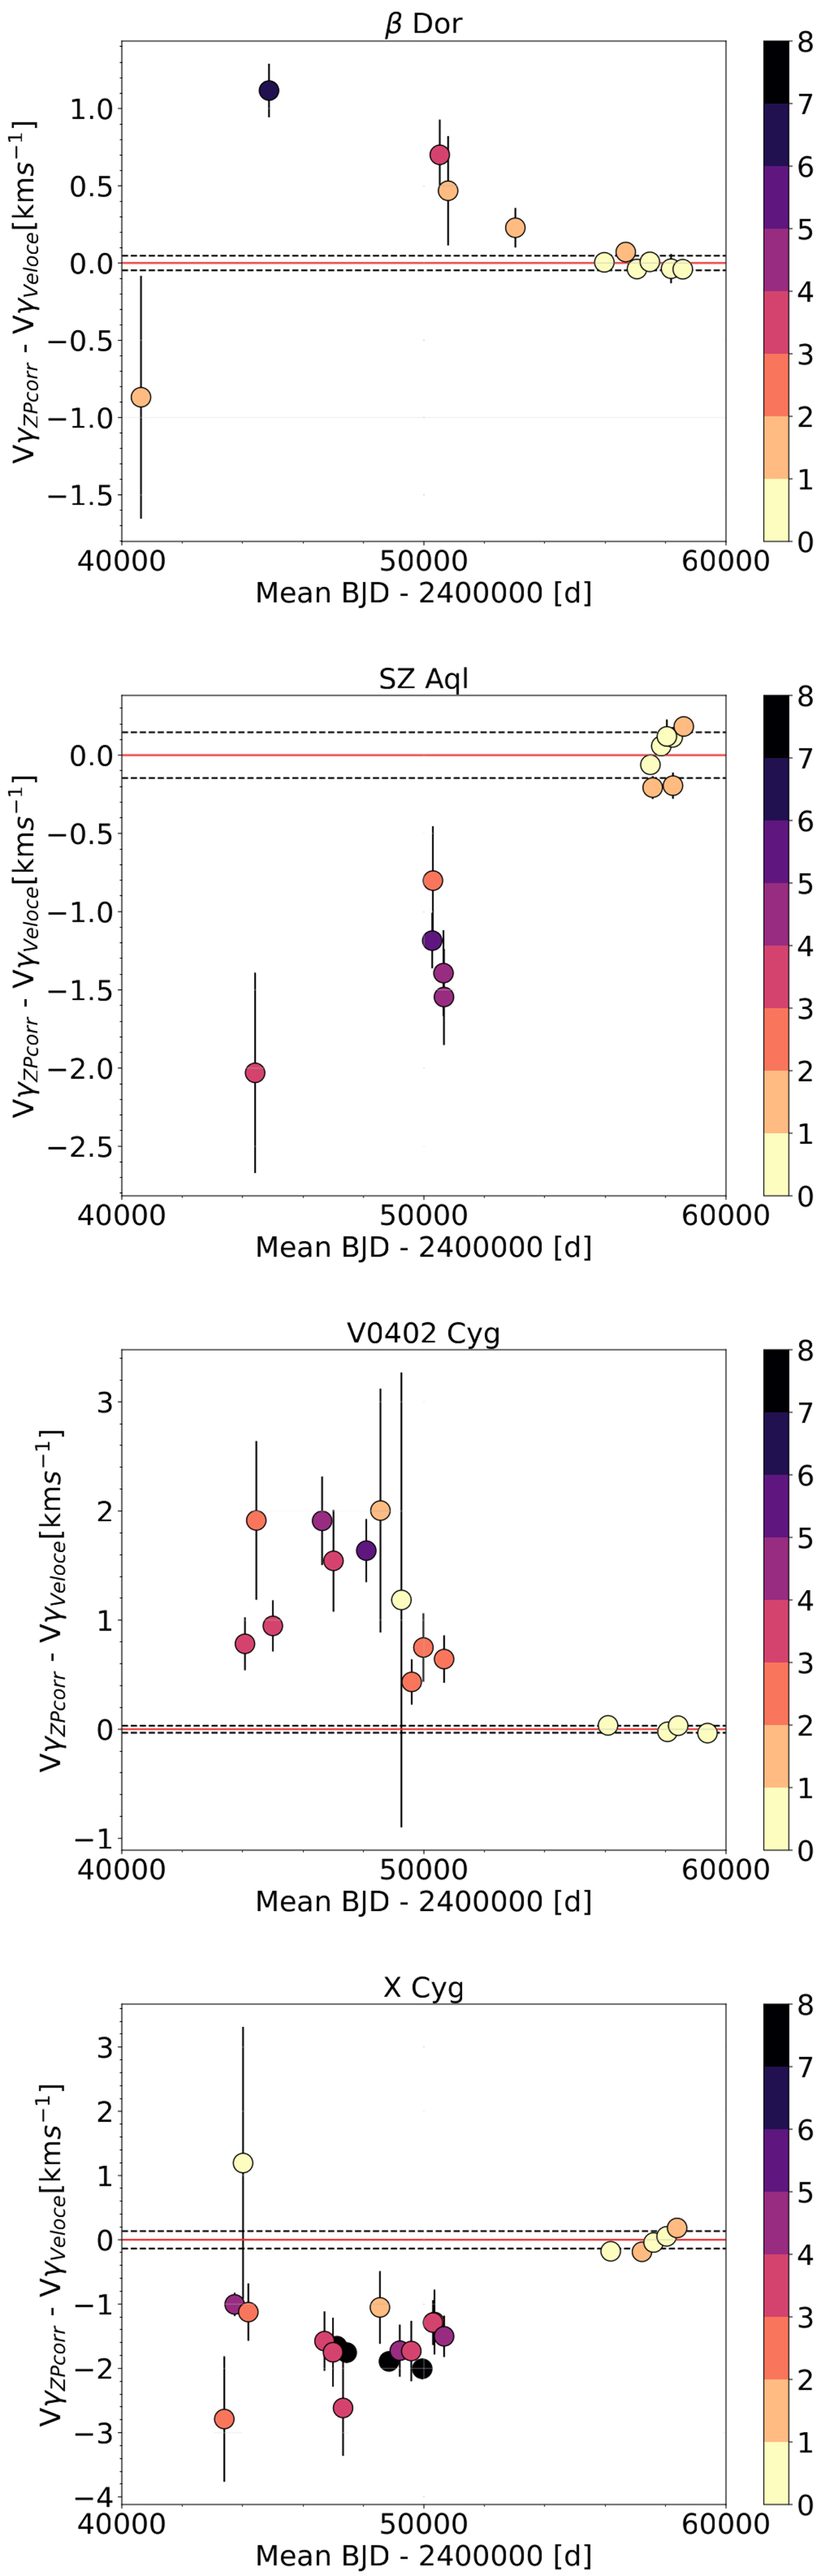
Fig. 7.
Download original image
Zero-point corrected Δvγ for new SB1s detected through RVTF. The dotted lines mark the standard deviation of the vγVELOCE. This figure only includes stars where we have a 3-σ detection through our analysis. The color bar represents the S/NSB1 of the various vγ measurements where the S/NSB1 was calculated as described in the text.
Current usage metrics show cumulative count of Article Views (full-text article views including HTML views, PDF and ePub downloads, according to the available data) and Abstracts Views on Vision4Press platform.
Data correspond to usage on the plateform after 2015. The current usage metrics is available 48-96 hours after online publication and is updated daily on week days.
Initial download of the metrics may take a while.