| Issue |
A&A
Volume 684, April 2024
|
|
|---|---|---|
| Article Number | L9 | |
| Number of page(s) | 5 | |
| Section | Letters to the Editor | |
| DOI | https://doi.org/10.1051/0004-6361/202449600 | |
| Published online | 10 April 2024 | |
Letter to the Editor
The orbital parameters of the δ Cep inner binary system determined using 2019 HARPS-N spectroscopic data
1
Université Côte d’Azur, Observatoire de la Côte d’Azur, CNRS, Laboratoire Lagrange, Nice, France
e-mail: This email address is being protected from spambots. You need JavaScript enabled to view it.
2
Nicolaus Copernicus Astronomical Center, Polish Academy of Sciences, ul. Bartycka 18, 00-716 Warszawa, Poland
3
LESIA (UMR 8109), Observatoire de Paris, PSL, CNRS, UPMC, Univ. Paris-Diderot, 5 place Jules Janssen, Meudon, France
4
Instituto de Astrofísica, Departamento de Ciencias Físicas, Facultad de Ciencias Exactas, Universidad Andrés Bello, Fernández Concha 700, Las Condes, Santiago, Chile
5
Universidad de Concepción, Departamento de Astronomía, Casilla 160-C, Concepción, Chile
6
Unidad Mixta Internacional Franco-Chilena de Astronomía (CNRS UMI 3386), Departamento de Astronomía, Universidad de Chile, Camino El Observatorio 1515, Las Condes, Santiago, Chile
7
European Southern Observatory, Alonso de Córdova 3107, Casilla, 19001 Santiago 19, Chile
8
INAF – Osservatorio Astronomico di Brera, Via E. Bianchi 46, 23807 Merate (LC), Italy
9
Leibniz Institute for Astrophysics, An der Sternwarte 16, 14482 Potsdam, Germany
Received:
13
February
2024
Accepted:
22
March
2024
Abstract
Context. An inner companion has recently been discovered orbiting the prototype of classical Cepheids, δ Cep, whose orbital parameters are still not fully constrained.
Aims. We collected new precise radial velocity measurements of δ Cep in 2019 using the HARPS-N spectrograph mounted at the Telescopio Nazionale Galileo. Using these radial velocity measurements, we aimed to improve the orbital parameters of the system.
Methods. We considered a template available in the literature as a reference for the radial velocity curve of the pulsation of the star. We then calculated the residuals between our global dataset (composed of the new 2019 observations plus data from the literature) and the template as a function of the pulsation phase and the barycentric Julian date. This provides the orbital velocity of the Cepheid component. Using a Bayesian tool, we derived the orbital parameters of the system.
Results. Considering priors based on already published Gaia constraints, we find for the orbital period a maximum a posteriori probability of Porb = 9.32−0.04+0.03 years (uncertainties correspond to the 95% highest density probability interval), and we obtain an eccentricity e = 0.71−0.02+0.02, a semimajor axis a = 0.029−0.003+0.002 arcsec, and a center-of-mass velocity V0 = −17.28−0.08+0.08 km s−1, among other parameters.
Conclusions. In this short analysis we derive the orbital parameters of the δ Cep inner binary system and provide a cleaned radial velocity curve of the pulsation of the star, which will be used to study its Baade–Wesselink projection factor in a future publication.
Key words: binaries : close / binaries: spectroscopic / stars: oscillations / stars: individual: δ Cep / stars: variables: Cepheids
© The Authors 2024
 Open Access article, published by EDP Sciences, under the terms of the Creative Commons Attribution License (https://creativecommons.org/licenses/by/4.0), which permits unrestricted use, distribution, and reproduction in any medium, provided the original work is properly cited.
This article is published in open access under the Subscribe to Open model. This email address is being protected from spambots. You need JavaScript enabled to view it. to support open access publication.
1. Introduction
Delta Cep is the prototype of classical Cepheid variable stars. Its variability was discovered by Goodricke (1786), and to this day the star remains a cornerstone for the calibration of the distance scale. It is in particular a benchmark star for the calibration of the projection factor (Nardetto et al. 2004, 2006, 2017), a physical quantity that plays a central role in the Baade–Wesselink method (Baade 1926; Wesselink 1946) of distance determination (Storm et al. 2011a,b; Trahin et al. 2021). δ Cep was recently discovered to be a spectroscopic binary (Anderson et al. 2015). Before, the star was thought to be a visual binary (Fernie 1966).
Because of the configuration of the system in 2015 when their spectroscopic data were secured with the High Accuracy Radial velocity Planet Searcher for the Northern hemisphere (HARPS-N) instrument, Nardetto et al. (2017) did not detect any evidence of an inner companion. However, in 2019, simultaneous data with the HARPS-N and GIANO instruments were secured for a set of five Cepheids, including δ Cep, using the GIARPS (GIAno & haRPS) mode (Claudi et al. 2016). Two studies focused on the He I 10 830 Å spectral line and the effective temperature determination of Cepheids, respectively (Andrievsky et al. 2023; Kovtyukh et al. 2023). In this Letter we report the 2019 HARPS-N radial velocity measurements of δ Cep and present clear evidence of the presence of an inner companion (Sect. 2). We used these data, together with data from the literature (Sect. 3), to derive the orbital parameters of the system using a Bayesian approach (Sect. 4). The results presented in Sect. 5 include a cleaned radial velocity curve of δ Cep, with the companion removed, that will be used in a forthcoming publication.
2. HARPS-N spectroscopic observations of δ Cep
We secured 24 HARPS-N spectroscopic measurements of δ Cep from 14 June to 21 September 2019. HARPS-N is the northern hemisphere counterpart of the HARPS instrument installed at the ESO 3.6 m telescope at La Silla Observatory in Chile (Cosentino et al. 2012). The instrument covers the wavelength range from 3800 to 6900 Å with a resolving power of R ≃ 115 000. The data span 13 cycles of pulsation from the first to last epoch. δ Cep shows secular period changes, as shown in the O–C diagram of Csörnyei et al. (2022). We thus used the ephemeris from Csörnyei et al. (2022) to calculate the pulsation phase for each individual observation: T0 = 2 412 028.256 d, PPuls = 5.3663671 d, and  days yr−1. The final products of the HARPS-N data reduction software installed at the Telescopio Nazionale Galileo (online mode) are background-subtracted, cosmic-corrected, flat-fielded, and wavelength-calibrated spectra (with and without merging of the spectral orders). To calculate the cross-correlated velocity, we used the iSpec tool with a G2V template (Blanco-Cuaresma et al. 2014; Blanco-Cuaresma 2019). As discussed in Nardetto et al. (2023), there is no difference in the derived radial velocities when using a G2V or an F6I template. We then applied a Gaussian fit to the cross-correlated function to derive the radial velocity (RVcc-g) and its uncertainty. The results are presented in Table 1 and in the left panel of Fig. 1 (see the blue triangles). We clearly see a dispersion in the radial velocity measurements from 1994 to 2019, and we show in this Letter that this is due to the presence of a companion.
 |
Fig. 1. Radial velocity curves of δ Cep without correction from the presence of the companion. Left: comparison of the high-quality cross-correlated radial velocity curves, RVcc-g (Gaussian fit of the cross-correlated function), of δ Cep available in the literature. These data are not corrected for the center-of-mass velocity variation due to the inner companion, which explains the dispersion obtained in the curves. The data studied in this work are shown with blue triangles. For comparison, the pulsation template provided by Hocdé et al. (2023) (green curve) has been shifted by the γ velocity of −16.95 km s−1 found by Nardetto et al. (2017). Middle: radial velocity curve from the left panel compared to the pulsation template. Right: same as the middle panel but as a function of the BJD. The long-term velocity variation due to the companion is clearly seen. |
HARPS-N RVcc-g radial velocities of δ Cep.
3. Spectroscopic data in the literature
To derive the orbital parameters of the SB1 binary system composed of δ Cep and its inner companion, we needed to first extract the long-term orbital radial velocity of the system, that is to say, we had to remove the pulsation motion from the individual radial velocity measurements. For this, we considered the best-quality data in the literature, from Bersier et al. (1994), Storm et al. (2004), Barnes et al. (2005), Anderson et al. (2015), and Nardetto et al. (2017), as well as data from Gaia Data Release 3 (DR3; Gaia Collaboration 2016, 2023). The radial velocity measurements are presented in the left panel of Fig. 1. The next step was to subtract the pulsation velocity from all these data in order to extract the orbital radial velocity of the Cepheid component. In this work, we used the radial velocity curve template provided by Hocdé et al. (2023) based on the data from Anderson et al. (2015) as a reference for the radial velocity associated with the pulsation motion of the star (see the solid green line in the left panel of Fig. 1). This template by definition has a γ velocity (i.e., an average value) of zero. Nardetto et al. (2017) investigated the possible effect of the binary motion due to the companion as discovered earlier by Anderson et al. (2015) but concluded that including a linear trend of −0.5 ± 0.1 m s−1 d−1 did not significantly reduce the residual in their measurements, which is of 0.5 m s−1). Disentangling the γ velocity of the Cepheid and the receding or approaching motion of the center-of-mass velocity of the system for a given dataset is not simple, in particular when considering that the granulation of the star can affect the γ velocity, as shown for the first time by Nardetto et al. (2008) and Vasilyev et al. (2017, 2018). We see in Fig. 1 that the template from Hocdé et al. (2023), shifted by the γ velocity value of −16.95 ± 0.005 km s−1 found by Nardetto et al. (2017), is indeed very close to the radial velocity curve obtained by Nardetto et al. (2017, see the green triangles).
The residual between the data in the literature and our template is plotted as a function of the pulsation phase and barycentric Julian date (BJD) in the middle and right panels of Fig. 1, respectively. As discussed in Anderson et al. (2015), there are some systematical velocity offsets between the instruments used by the different authors (∼0.3 km s−1 at most), and possibly also drifts with time (∼0.02 km s−1), but they are difficult to determine for each instrument and are not free of errors. In this study we decided not to take them into account. We instead conducted some tests and show that such offsets have a negligible impact on our orbital parameter solution (see Sect. 5).
4. A Bayesian approach to deriving the orbital parameters of the system
We applied a Bayesian inference methodology for the estimation of the orbital parameters to the single-line spectroscopic observations of δ Cep, based on the No-U-Turn sampler Markov chain Monte Carlo algorithm. For this, we used the BinaryStar tool available on GitHub1 (Carpenter et al. 2017; Videla et al. 2022). This tool is designed to provide a precise and efficient estimation of the joint posterior distribution of the orbital parameters in the presence of partial and heterogeneous observations. The tool allows to directly incorporate prior informations on the system. We defined five priors. First, we used the trigonometric parallax of the companion of δ Cep as found by Kervella et al. (2019): π = 3.364 ± 0.049 mas. The parallax from Gaia DR3, π = 3.5551 ± 0.1475 mas (Gaia Collaboration 2023), has a renormalized unit weight error of 2.7, indicating that it is not reliable. We also used four non-spectroscopic parameters from Kervella et al. (2019, see their Table 2) based on Gaia: the estimation of the mass of the primary and secondary components, m1 = 4.8 ± 0.72 M⊙ and m2 = 0.72 ± 0.11 M⊙, the orbital inclination, i = 163 ± 14 deg, and the longitude of the ascending node, Ω = 83 ± 27 deg. To ensure a Bayesian fit, we assumed a homogeneous uncertainty for all the radial velocity values in all datasets of 0.15 km s−1, which corresponds to the average of all the available uncertainties.
The outputs of our model are π, i, Ω, the time of periastron passage (T), the orbital period (Porb), the orbital eccentricity (e), the orbital semimajor axis (a), the argument of periapsis (ω), the mass ratio of the individual components  , the velocity of the center of mass (V0), and
  , where
  is the fractional mass of the system. We ran different tests. We started by considering only two priors (π and m1), but Ω, i,
  , and q were poorly constrained in this case. Thus, we decided to take all five priors into account (Kervella et al. 2019). Using two or five priors does not significantly change the results regarding T, Porb, e, a, or ω.
5. Results and discussion
The marginal posterior distributions of the orbital parameters are presented in Fig. 3. The maximum a posteriori probabilities (MAPs) as derived from the Bayesian inference in the multi-parameter space are indicated for each parameter with a vertical red line and are listed in Table 2. The horizontal black line shows the 95% highest density probability intervals (HDPIs). The HDPI values are indicated in the figure and are also reported in Table 2. The left panel of Fig. 4 shows the maximum probability visual estimated orbit (black line) together with the whole distribution of possible orbits (light gray lines). The right panel shows the same, but for the maximum probability of the orbital radial velocity curve, with the spectroscopic measurements presented in Sect. 3 overlaid. We also indicate at the bottom of the figure the mean uncertainties associated with each dataset. The scatter of old data (before the year 2000) compared to the orbital model appears larger than the individual uncertainties. This might be due to the fact that our template model of the pulsation of the star, based on the recent data from Anderson et al. (2015), is not totally adapted to these old datasets because of uncorrected residuals in the secular period variation of the star (Csörnyei et al. 2022). Using the maximum probability model (black line in the right panel of Fig. 4), we can correct all the spectroscopic radial velocity measurements in our sample for the orbital velocity of the Cepheid component (vorb). The derived corrected radial velocities are plotted in the left panel of Fig. 2, and the residuals compared to our reference pulsation velocity template are shown as a function of the pulsation phase and BJD in the middle and right panels, respectively. The vorb in the case of our new HARPS-N data from 2019 are indicated in Table 1, and the final corrected radial velocity curve is plotted in Fig. 5.
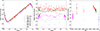 |
Fig. 2. Same as Fig. 1 but after correction for the orbital velocity of the Cepheid component as described by the parameters listed in Table 2. The residuals in the middle and right panels are plotted as a function of the pulsation phase and BJD, respectively. The derived pulsation velocity curves shown in the left panel, including that from this work (blue open diamonds), have a dispersion much lower than in the left panel of Fig. 1. The rms residuals in the middle and right panels are about 0.4 km s−1. The RVcc-g curve corrected for the binarity and corresponding to this work is also shown in Fig. 5. |
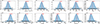 |
Fig. 3. Marginal posterior distribution of the orbital parameters of the δ Cep system (SB1). The vertical line and the values in red correspond to the MAP of the Bayesian inference in the multi-parameter space, and the horizontal black line corresponds to the 95% HDPIs. These values are listed in Table 2. |
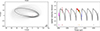 |
Fig. 4. MAP point estimate projection of the a posteriori distribution for the estimated orbit (left panel) and the RV curve (right panel) for the SB1 system of δ Cep. The dark line corresponds to the MAP, and the light gray line shows the whole distribution. In the right panel, the radial velocity measurements are indicated with the same colors as in Figs. 1 and 2. The mean uncertainties corresponding to each dataset are indicated at the bottom of the figure. The Barnes et al. (2005) dataset (shown with light pink diamonds) does not provide uncertainties. At the bottom right of the figure, we indicate in black the mean homogeneous uncertainty of 0.15 km s−1 that we used for all dataset measurements to ensure a Bayesian fit. |
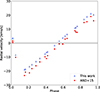 |
Fig. 5. Final corrected RVcc-g curve of the HARPS-N data of δ Cep presented in this paper (blue triangles). For comparison, we also plot the corrected radial velocities determined when using the spectroscopic orbital parameters as found by Anderson et al. (2016) (red squares). |
MAP and 95% HDPIs of the orbital parameters of the δ Cep SB1 binary system as derived from the Bayesian analysis.
As shown by Table 2 and in Fig. 3, the orbital parameters are relatively well constrained. Anderson et al. (2016) found an orbital period of about Porb = 6.028 ± 0.016 years (median value of the distribution of probability), while we found a MAP of Porb = 9.32 years. The two periods remain in the ratio 2:3, and the correct count of the elapsed cycles is not easy to determine when the rapid radial velocity variability due to an eccentric orbit is confined to a small phase interval and the observed radial velocity curve shows large gaps. In this respect, our 2019 data are particularly constraining since they cover the quick ascending branch (see the right panel of Fig. 4). The derived radial velocity curve of δ Cep we obtain is of very good quality (Fig. 5). For comparison, in Fig. 5 we also plot the corrected radial velocity when using the spectroscopic orbital parameters as found by Anderson et al. (2016, see the red squares). As an additional test, we arbitrarily considered offsets of ±0.3 km s−1 on the different datasets used in this study, including our 2019 HARPS data, to simulate potential systematics or drifts in time between the different spectrographs. We find consistent MAP parameters (i.e., consistent within their uncertainties). The rms of the residuals that we obtain using the orbital parameters we found is about 0.4 km s−1 (Fig. 2, middle and right panels).
6. Conclusion
Using our latest HARPS-N spectroscopic dataset, from 2019, as well as data from the literature, we derived the orbital parameters of the SB1 binary system of the prototype of classical Cepheids, δ Cep. This allowed us to extract the radial velocity curve associated with the pulsation of δ Cep, which is crucial to continuing our study of the dynamical structure of this star and, in particular, the Baade–Wesselink projection factor for Cepheids. According to our results, the system is now just after the quadrature in terms of orbital velocity, and securing new data in the near future will certainly help in confirming the orbital solution of the system. Furthermore, the fourth Gaia data release will provide the epoch astrometric positions of the system, which will constrain the orientation of the orbit on the sky. As discussed in Anderson et al. (2016), the discovery and characterization of the inner companion of δ Cep is important and should be investigated in the coming decade.
Acknowledgments
The observations leading to these results have received funding from the European Commission’s Seventh Framework Programme (FP7/2013-2016) under grant agreement number 312430 (OPTICON). The authors thank the GAPS observers F. Borsa, L. Di Fabrizio, R. Fares, A. Fiorenzano, P. Giacobbe, J. Maldonado, and G. Scandariato. This research has made use of the SIMBAD and VIZIER (available at http://cdsweb.u-strasbg.fr/) databases at CDS, Strasbourg (France), and of the electronic bibliography maintained by the NASA/ADS system. W.G. gratefully acknowledges financial support for this work from the BASAL Centro de Astrofisica y Tecnologias Afines (CATA) PFB-06/2007, and from the Millenium Institute of Astrophysics (MAS) of the Iniciativa Cientifica Milenio del Ministerio de Economia, Fomento y Turismo de Chile, project IC120009. W.G. also acknowledges support from the ANID BASAL project ACE210002. Support from the Polish National Science Center grant MAESTRO 2012/06/A/ST9/00269 and DIR-WSIB.92.2.2024 grants of the Polish Ministry of Science and Higher Education is also acknowledged. A.G. acknowledges the support of the Agencia Nacional de Investigación Científica y Desarrollo (ANID) through the FONDECYT Regular grant 1241073. The authors acknowledge the support of the French Agence Nationale de la Recherche (ANR), under grant ANR-23-CE31-0009-01 (Unlock-pfactor) and the financial support from “Programme National de Physique Stellaire” (PNPS) of CNRS/INSU, France. A.G. acknowledges support from the ANID-ALMA fund No. ASTRO20-0059. B.P. gratefully acknowledges support from the Polish National Science Center grant SONATA BIS 2020/38/E/ST9/00486. This work has made use of data from the European Space Agency (ESA) mission Gaia, processed by the Gaia Data Processing and Analysis Consortium (DPAC). Funding for the DPAC has been provided by national institutions, in particular the institutions participating in the Gaia Multilateral Agreement. The research leading to these results has received funding from the European Research Council (ERC) under the European Union’s Horizon 2020 research and innovation program (projects CepBin, grant agreement 695099, and UniverScale, grant agreement 951549). This work has made use of data from the European Space Agency (ESA) mission Gaia (https://www.cosmos.esa.int/gaia), processed by the Gaia Data Processing and Analysis Consortium (DPAC, https://www.cosmos.esa.int/web/gaia/dpac/consortium). Funding for the DPAC has been provided by national institutions, in particular the institutions participating in the Gaia Multilateral Agreement.
References
- Anderson, R. I., Sahlmann, J., Holl, B., et al. 2015, ApJ, 804, 144 [CrossRef] [Google Scholar]
- Anderson, R. I., Mérand, A., Kervella, P., et al. 2016, MNRAS, 455, 4231 [Google Scholar]
- Andrievsky, S. M., Kovtyukh, V. V., & Korotin, S. A. 2023, A&A, 671, A27 [NASA ADS] [CrossRef] [EDP Sciences] [Google Scholar]
- Baade, W. 1926, Astron. Nachr., 228, 359 [NASA ADS] [CrossRef] [Google Scholar]
- Barnes, T. G., III, Storm, J., Jefferys, W. H., Gieren, W. P., & Fouqué, P. 2005, ApJ, 631, 572 [NASA ADS] [CrossRef] [Google Scholar]
- Bersier, D., Burki, G., Mayor, M., & Duquennoy, A. 1994, A&AS, 108, 25 [NASA ADS] [Google Scholar]
- Blanco-Cuaresma, S. 2019, MNRAS, 486, 2075 [Google Scholar]
- Blanco-Cuaresma, S., Soubiran, C., Heiter, U., & Jofré, P. 2014, A&A, 569, A111 [CrossRef] [EDP Sciences] [Google Scholar]
- Carpenter, B., Gelman, A., Hoffman, M. D., et al. 2017, J. Stat. Softw., 76, 1 [NASA ADS] [CrossRef] [Google Scholar]
- Claudi, R., Benatti, S., Carleo, I., et al. 2016, in Ground-Based and Airborne Instrumentation for Astronomy VI, Proc. SPIE, 9908, 99081A [NASA ADS] [Google Scholar]
- Cosentino, R., Lovis, C., Pepe, F., et al. 2012, SPIE Conf. Ser., 8446, 1 [Google Scholar]
- Csörnyei, G., Szabados, L., Molnár, L., et al. 2022, MNRAS, 511, 2125 [CrossRef] [Google Scholar]
- Fernie, J. D. 1966, AJ, 71, 119 [NASA ADS] [CrossRef] [Google Scholar]
- Gaia Collaboration (Prusti, T., et al.) 2016, A&A, 595, A1 [NASA ADS] [CrossRef] [EDP Sciences] [Google Scholar]
- Gaia Collaboration (Vallenari, A., et al.) 2023, A&A, 674, A1 [NASA ADS] [CrossRef] [EDP Sciences] [Google Scholar]
- Goodricke, J. 1786, Phil. Trans. Royal Soc. London Ser. I, 76, 48 [CrossRef] [Google Scholar]
- Hocdé, V., Moskalik, P., Gorynya, N. A., et al. 2023, A&A, submitted [arXiv:2312.11407] [Google Scholar]
- Kervella, P., Gallenne, A., Remage Evans, N., et al. 2019, A&A, 623, A116 [NASA ADS] [CrossRef] [EDP Sciences] [Google Scholar]
- Kovtyukh, V., Lemasle, B., Nardetto, N., et al. 2023, MNRAS, 523, 5047 [CrossRef] [Google Scholar]
- Nardetto, N., Fokin, A., Mourard, D., et al. 2004, A&A, 428, 131 [CrossRef] [EDP Sciences] [Google Scholar]
- Nardetto, N., Fokin, A., Mourard, D., & Mathias, P. 2006, A&A, 454, 327 [NASA ADS] [CrossRef] [EDP Sciences] [Google Scholar]
- Nardetto, N., Stoekl, A., Bersier, D., & Barnes, T. G. 2008, A&A, 489, 1255 [NASA ADS] [CrossRef] [EDP Sciences] [Google Scholar]
- Nardetto, N., Poretti, E., Rainer, M., et al. 2017, A&A, 597, A73 [CrossRef] [EDP Sciences] [Google Scholar]
- Nardetto, N., Gieren, W., Storm, J., et al. 2023, A&A, 671, A14 [NASA ADS] [CrossRef] [EDP Sciences] [Google Scholar]
- Storm, J., Carney, B. W., Gieren, W. P., et al. 2004, A&A, 415, 521 [NASA ADS] [CrossRef] [EDP Sciences] [Google Scholar]
- Storm, J., Gieren, W., Fouqué, P., et al. 2011a, A&A, 534, A94 [CrossRef] [EDP Sciences] [Google Scholar]
- Storm, J., Gieren, W., Fouqué, P., et al. 2011b, A&A, 534, A95 [NASA ADS] [CrossRef] [EDP Sciences] [Google Scholar]
- Trahin, B., Breuval, L., Kervella, P., et al. 2021, A&A, 656, A102 [NASA ADS] [CrossRef] [EDP Sciences] [Google Scholar]
- Vasilyev, V., Ludwig, H. G., Freytag, B., Lemasle, B., & Marconi, M. 2017, A&A, 606, A140 [NASA ADS] [CrossRef] [EDP Sciences] [Google Scholar]
- Vasilyev, V., Ludwig, H.-G., Freytag, B., Lemasle, B., & Marconi, M. 2018, A&A, 611, A19 [NASA ADS] [CrossRef] [EDP Sciences] [Google Scholar]
- Videla, M., Mendez, R. A., Clavería, R. M., Silva, J. F., & Orchard, M. E. 2022, AJ, 163, 220 [NASA ADS] [CrossRef] [Google Scholar]
- Wesselink, A. J. 1946, Bull. Astron. Inst. Neth., 10, 91 [NASA ADS] [Google Scholar]
All Tables
MAP and 95% HDPIs of the orbital parameters of the δ Cep SB1 binary system as derived from the Bayesian analysis.
All Figures
|
Fig. 1. Radial velocity curves of δ Cep without correction from the presence of the companion. Left: comparison of the high-quality cross-correlated radial velocity curves, RVcc-g (Gaussian fit of the cross-correlated function), of δ Cep available in the literature. These data are not corrected for the center-of-mass velocity variation due to the inner companion, which explains the dispersion obtained in the curves. The data studied in this work are shown with blue triangles. For comparison, the pulsation template provided by Hocdé et al. (2023) (green curve) has been shifted by the γ velocity of −16.95 km s−1 found by Nardetto et al. (2017). Middle: radial velocity curve from the left panel compared to the pulsation template. Right: same as the middle panel but as a function of the BJD. The long-term velocity variation due to the companion is clearly seen. |
| In the text | |
|
Fig. 2. Same as Fig. 1 but after correction for the orbital velocity of the Cepheid component as described by the parameters listed in Table 2. The residuals in the middle and right panels are plotted as a function of the pulsation phase and BJD, respectively. The derived pulsation velocity curves shown in the left panel, including that from this work (blue open diamonds), have a dispersion much lower than in the left panel of Fig. 1. The rms residuals in the middle and right panels are about 0.4 km s−1. The RVcc-g curve corrected for the binarity and corresponding to this work is also shown in Fig. 5. |
| In the text | |
|
Fig. 3. Marginal posterior distribution of the orbital parameters of the δ Cep system (SB1). The vertical line and the values in red correspond to the MAP of the Bayesian inference in the multi-parameter space, and the horizontal black line corresponds to the 95% HDPIs. These values are listed in Table 2. |
| In the text | |
|
Fig. 4. MAP point estimate projection of the a posteriori distribution for the estimated orbit (left panel) and the RV curve (right panel) for the SB1 system of δ Cep. The dark line corresponds to the MAP, and the light gray line shows the whole distribution. In the right panel, the radial velocity measurements are indicated with the same colors as in Figs. 1 and 2. The mean uncertainties corresponding to each dataset are indicated at the bottom of the figure. The Barnes et al. (2005) dataset (shown with light pink diamonds) does not provide uncertainties. At the bottom right of the figure, we indicate in black the mean homogeneous uncertainty of 0.15 km s−1 that we used for all dataset measurements to ensure a Bayesian fit. |
| In the text | |
|
Fig. 5. Final corrected RVcc-g curve of the HARPS-N data of δ Cep presented in this paper (blue triangles). For comparison, we also plot the corrected radial velocities determined when using the spectroscopic orbital parameters as found by Anderson et al. (2016) (red squares). |
| In the text | |
Current usage metrics show cumulative count of Article Views (full-text article views including HTML views, PDF and ePub downloads, according to the available data) and Abstracts Views on Vision4Press platform.
Data correspond to usage on the plateform after 2015. The current usage metrics is available 48-96 hours after online publication and is updated daily on week days.
Initial download of the metrics may take a while.