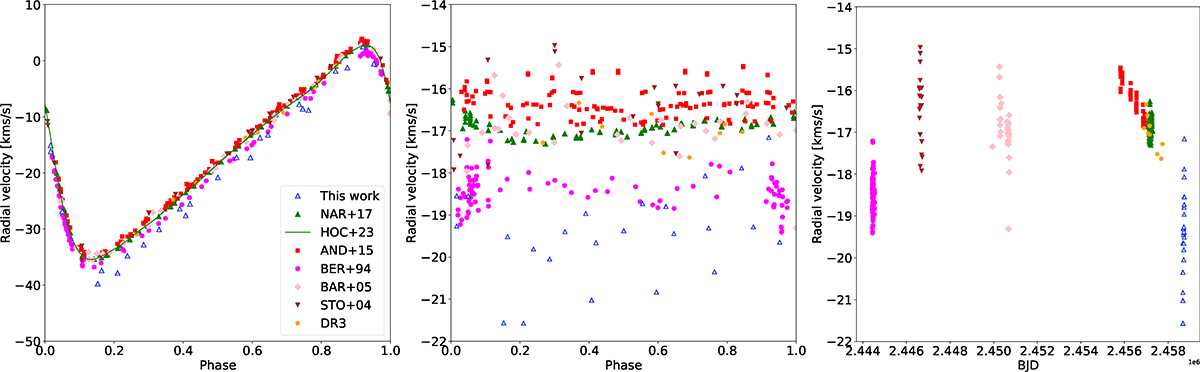
Fig. 2.
Download original image
Same as Fig. 1 but after correction for the orbital velocity of the Cepheid component as described by the parameters listed in Table 2. The residuals in the middle and right panels are plotted as a function of the pulsation phase and BJD, respectively. The derived pulsation velocity curves shown in the left panel, including that from this work (blue open diamonds), have a dispersion much lower than in the left panel of Fig. 1. The rms residuals in the middle and right panels are about 0.4 km s−1. The RVcc-g curve corrected for the binarity and corresponding to this work is also shown in Fig. 5.
Current usage metrics show cumulative count of Article Views (full-text article views including HTML views, PDF and ePub downloads, according to the available data) and Abstracts Views on Vision4Press platform.
Data correspond to usage on the plateform after 2015. The current usage metrics is available 48-96 hours after online publication and is updated daily on week days.
Initial download of the metrics may take a while.