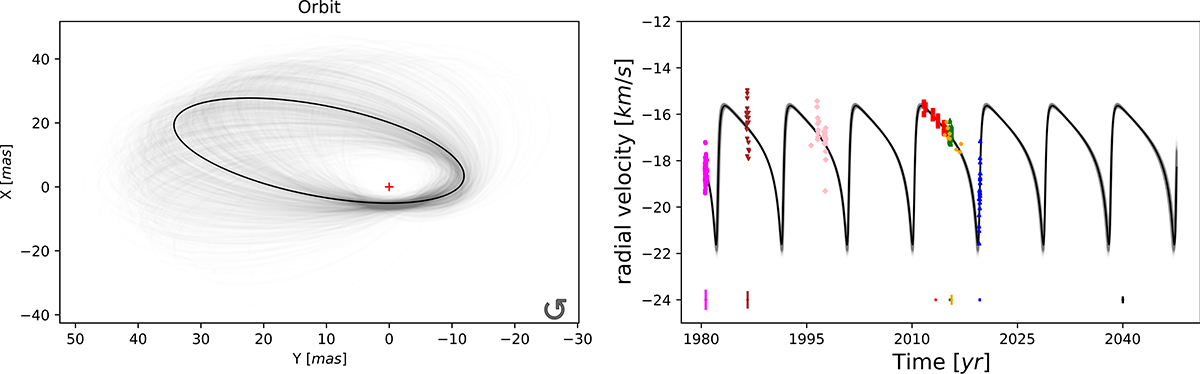
Fig. 4.
Download original image
MAP point estimate projection of the a posteriori distribution for the estimated orbit (left panel) and the RV curve (right panel) for the SB1 system of δ Cep. The dark line corresponds to the MAP, and the light gray line shows the whole distribution. In the right panel, the radial velocity measurements are indicated with the same colors as in Figs. 1 and 2. The mean uncertainties corresponding to each dataset are indicated at the bottom of the figure. The Barnes et al. (2005) dataset (shown with light pink diamonds) does not provide uncertainties. At the bottom right of the figure, we indicate in black the mean homogeneous uncertainty of 0.15 km s−1 that we used for all dataset measurements to ensure a Bayesian fit.
Current usage metrics show cumulative count of Article Views (full-text article views including HTML views, PDF and ePub downloads, according to the available data) and Abstracts Views on Vision4Press platform.
Data correspond to usage on the plateform after 2015. The current usage metrics is available 48-96 hours after online publication and is updated daily on week days.
Initial download of the metrics may take a while.