Fig. D.1.
Download original image
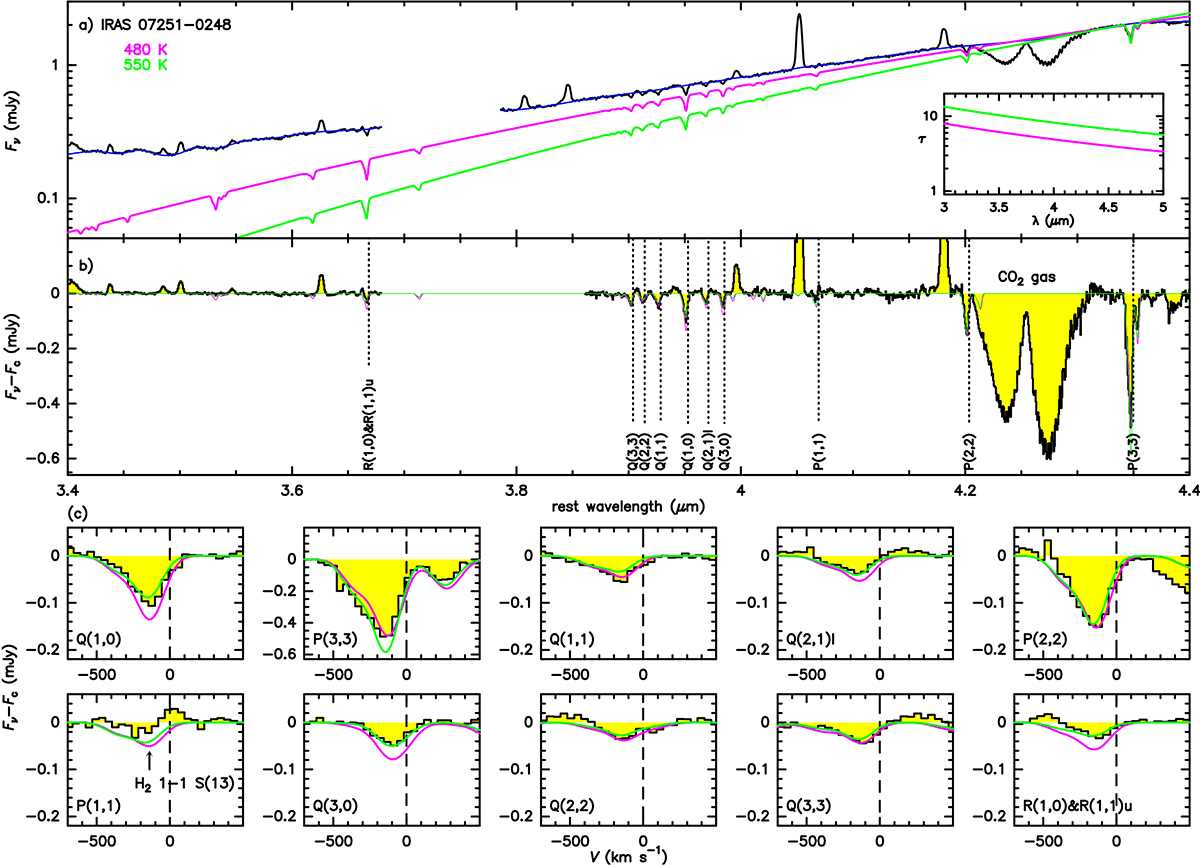
H3+ absorption in IRAS 07251−0248 and comparison with models. a) Observed 3.4 − 4.4 μm spectrum in IRAS 07251−0248 and adopted spline-interpolated baseline (in blue). The magenta and green lines show the modeled spectra, with the temperatures of the central source Tc and the hot-dust optical depth (τ in the inset) also indicated with colors. b) The continuum-subtracted spectrum (yellow histogram) is compared with the predictions by the two models. The spectra and models for individual lines are plotted in units of velocity in panel c. The vertical dashed line indicates the rest-frame zero velocity determined from the H2 and H I lines. The position of the H2 1 − 1 S(13) 4.068 μm line, which is blended with the P(1,1) 4.070 μm line, is indicated by an arrow.
Current usage metrics show cumulative count of Article Views (full-text article views including HTML views, PDF and ePub downloads, according to the available data) and Abstracts Views on Vision4Press platform.
Data correspond to usage on the plateform after 2015. The current usage metrics is available 48-96 hours after online publication and is updated daily on week days.
Initial download of the metrics may take a while.