Fig. A.1.
Download original image
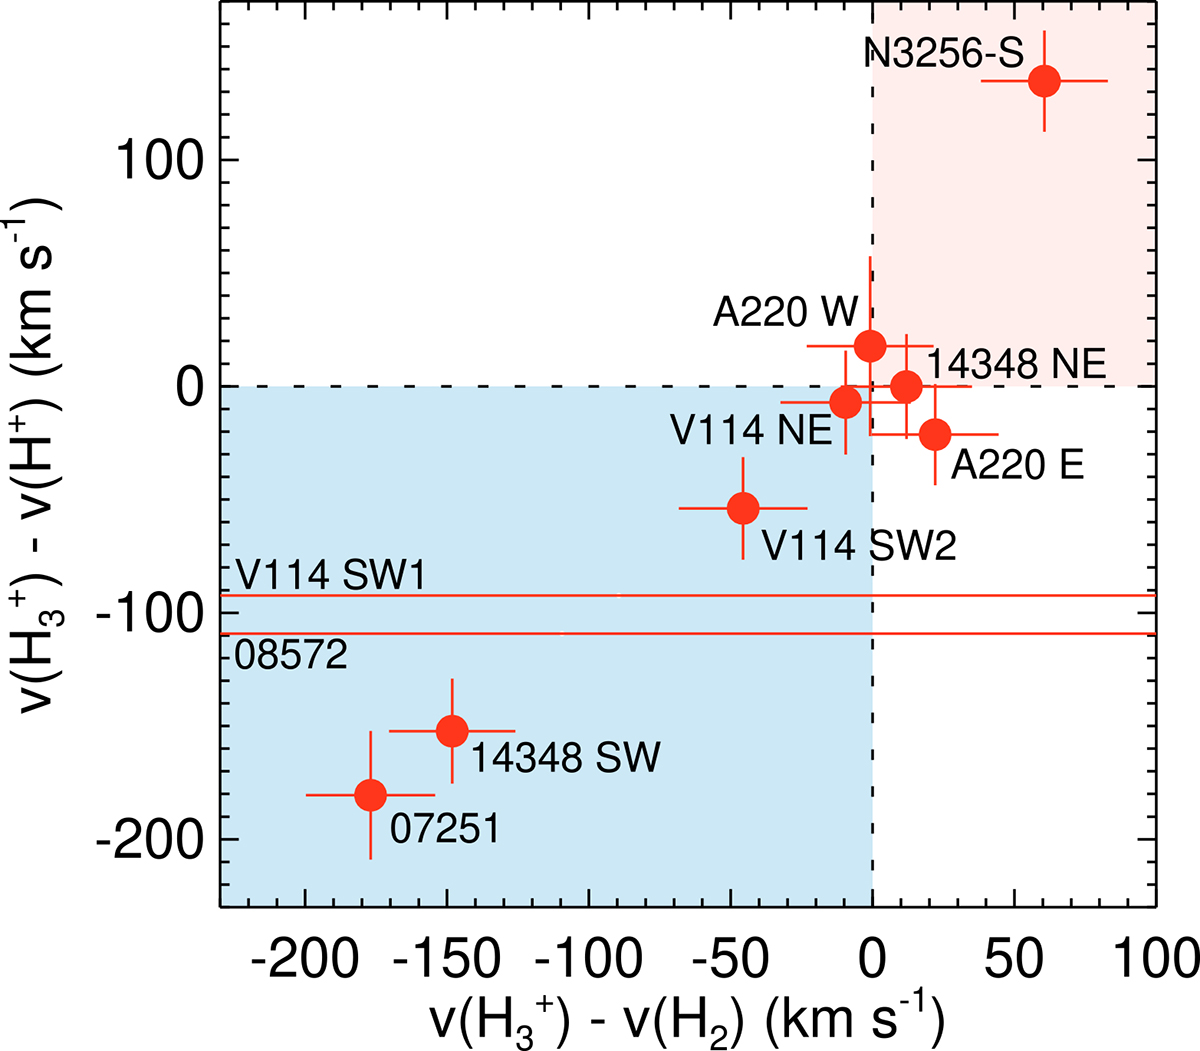
Comparison between the velocity measured for the H3+ absorptions and that of H2 (x axis) and H recombination lines (y axis). For two objects, no H2 lines are available, so the horizontal line marks the H3+ velocity relative to that of the H recombination lines. The shaded blue and red areas indicate blue and red velocity shifts, respectively.
Current usage metrics show cumulative count of Article Views (full-text article views including HTML views, PDF and ePub downloads, according to the available data) and Abstracts Views on Vision4Press platform.
Data correspond to usage on the plateform after 2015. The current usage metrics is available 48-96 hours after online publication and is updated daily on week days.
Initial download of the metrics may take a while.