Fig. 4.
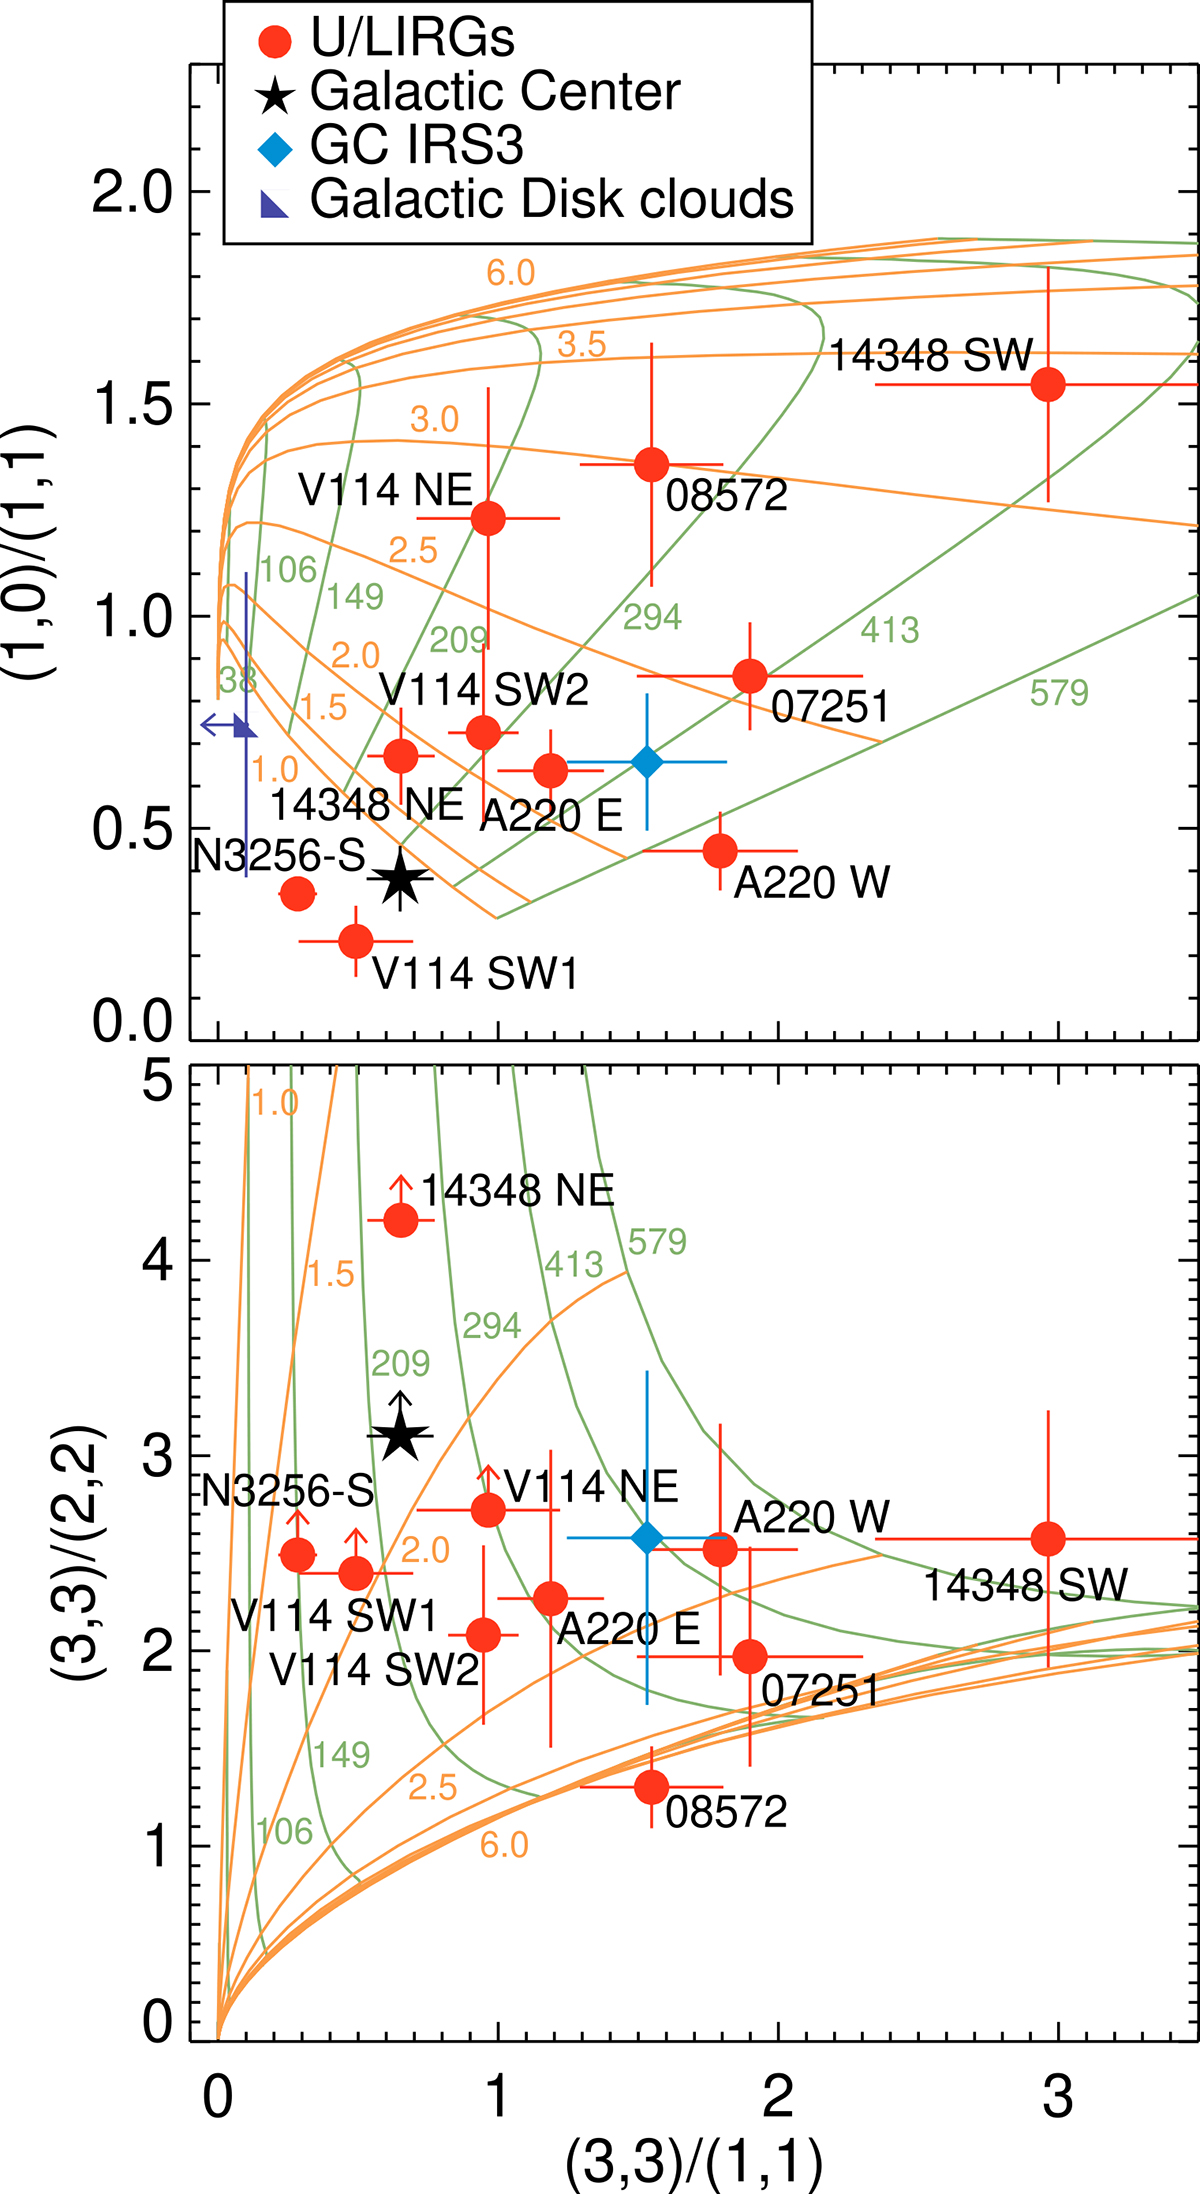
Download original image
Ratio between the column densities of H3+ levels: (1,0)/(1,1) vs. (3,3)/(1,1) (top); and (3,3)/(2,2) vs. (3,3)/(1,1) (bottom). Symbols as in Fig. 3. The blue diamond corresponds to the excited GC IRS 3 line of sight toward the GC, and the dark blue square in the top panel to diffuse and dense molecular clouds in the Galactic disk. The background grids show the ratios predicted by NLTE models. The green (orange) lines mark the ratios for the temperature, in K, (density, in log cm−3) indicated by the colored labels.
Current usage metrics show cumulative count of Article Views (full-text article views including HTML views, PDF and ePub downloads, according to the available data) and Abstracts Views on Vision4Press platform.
Data correspond to usage on the plateform after 2015. The current usage metrics is available 48-96 hours after online publication and is updated daily on week days.
Initial download of the metrics may take a while.