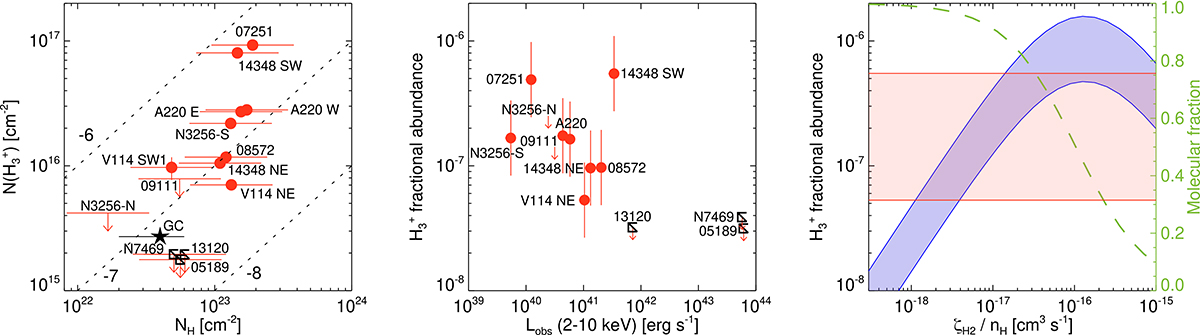
Fig. 3.
Download original image
H3+ fractional abundance. Left panel: H3+ vs. H column densities. The H column density corresponds to the obscuring material of the ∼4 μm continuum derived from the continuum differential extinction model (Sect. 3.1). The dashed lines indicate constant H3+ fractional abundances between 10−6 and 10−8 in steps of 1 dex. The red circles are the observed (U)LIRGs. The black star corresponds to the average columns in the GC from Goto et al. (2008) and Oka et al. (2019). Upper limits for Seyfert-type AGN are indicated by the empty black squares. Middle panel: H3+ fractional abundance as a function of the observed 2–10 keV X-ray luminosity. Right panel: Blue shaded area is the predicted H3+ fractional abundance (left y-axis) as a function of ζH2/nH estimated using Eq. 2 from Neufeld & Wolfire (2017) for xe in the range (1.5–5) × 10−4 (Sect. 3.1). The horizontal red shaded area indicates the range of H3+ fractional abundances measured in these (U)LIRGs. The dashed green line (right y-axis) is fH2 as function of ζH2/nH using Eq. 2 from González-Alfonso et al. (2013).
Current usage metrics show cumulative count of Article Views (full-text article views including HTML views, PDF and ePub downloads, according to the available data) and Abstracts Views on Vision4Press platform.
Data correspond to usage on the plateform after 2015. The current usage metrics is available 48-96 hours after online publication and is updated daily on week days.
Initial download of the metrics may take a while.