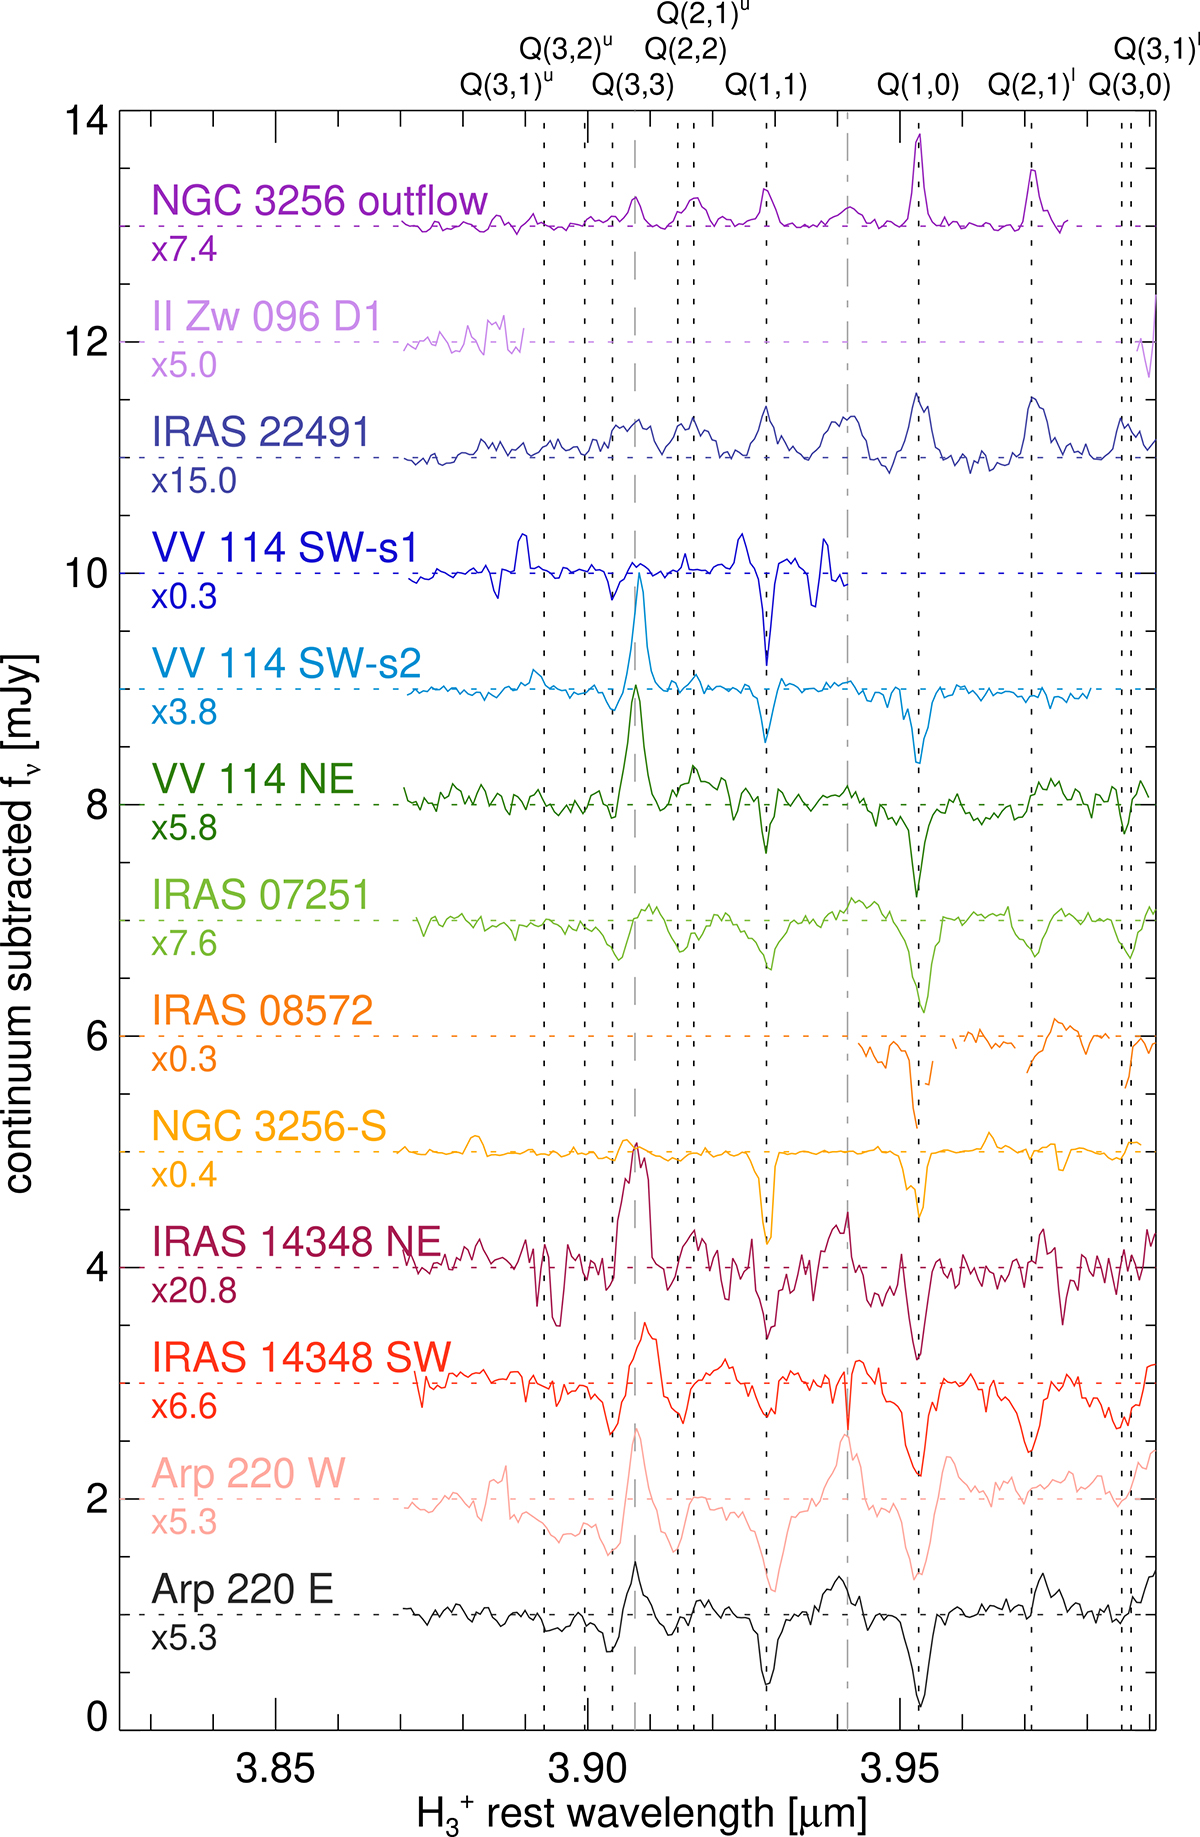
Fig. 1.
Download original image
Q branch of the fundamental rovibrational ν2 band of H3+ (P and R branches are shown in Fig. C.1). The JWST/NIRSpec spectra are continuum-subtracted (Sect. 2.3) and scaled. The H3+ transitions are labeled at the top of the panel and indicated by the dotted black vertical lines. Dashed and dot-dashed gray vertical lines indicate transitions of H2 and H I, respectively. The number below the region name is the scaling factor applied. In this figure, the rest frame is defined by the velocity of the H3+ features. We note that the JWST/NIRSpec spectra have a ∼0.1 μm gap centered around 4.05–4.15 μm that partially affects the Q branch of some of these regions. For IRAS 08572, we masked spectral channels with highly uncertain flux values.
Current usage metrics show cumulative count of Article Views (full-text article views including HTML views, PDF and ePub downloads, according to the available data) and Abstracts Views on Vision4Press platform.
Data correspond to usage on the plateform after 2015. The current usage metrics is available 48-96 hours after online publication and is updated daily on week days.
Initial download of the metrics may take a while.