| Issue |
A&A
Volume 689, September 2024
|
|
|---|---|---|
| Article Number | A10 | |
| Number of page(s) | 5 | |
| Section | Cosmology (including clusters of galaxies) | |
| DOI | https://doi.org/10.1051/0004-6361/202450835 | |
| Published online | 27 August 2024 | |
The cosmic timeline implied by the JWST reionization crisis
Department of Physics, The Applied Math Program, and Department of Astronomy, The University of Arizona, Tucson, AZ 85721, USA
Received:
22
May
2024
Accepted:
11
June
2024
Abstract
Context. JWST’s discovery of well-formed galaxies and supermassive black holes only a few hundred million years after the big bang, and the identification of polycyclic aromatic hydrocarbons (PAHs) at z = 6.71, seriously challenge the timeline predicted by ΛCDM. Moreover, the implied bright UV-irradiation of the early Universe suggests a reionization history much too short to comply with the observed evolution of the hydrogen ionization fraction, xHII(z).
Aims. A recent analysis of reionization after JWST concludes that the ΛCDM timeline simply cannot accommodate the combined JWST-Planck observations even if exotic fixes are introduced to modify the standard reionization model. In this paper, we argue that this so-called ‘photon budget crisis’ is more likely due to flaws in the cosmological model itself. We aim to reanalyze the data in the context of established astrophysics with Rh = ct as the background cosmology, an approach that has already been shown to mitigate the tension created by the too-early appearance of galaxies, quasars and PAHs.
Methods. We employ the standard reionization model using the JWST-measured UV luminosity function in the early Universe and the timeline and physical conditions in both ΛCDM and Rh = ct. The former has already been fully probed and discussed elsewhere, and we here merely redo the calculation to ensure consistency with their pioneering work. We then contrast the predicted reionization histories in these two scenarios and compare them with the data.
Results. We confirm that the reionization history predicted by ΛCDM is in significant tension with the observations, and demonstrate that the latter are instead in excellent agreement with the Rh = ct timeline.
Conclusions. Together, the four anomalies uncovered by JWST, including the newly discovered reionization crisis discussed in this paper, provide strong evidence against the timeline predicted by ΛCDM and in favor of the evolutionary history in Rh = ct.
Key words: cosmic background radiation / cosmology: observations / cosmology: theory / diffuse radiation / early Universe / large-scale structure of Universe
Corresponding author; This email address is being protected from spambots. You need JavaScript enabled to view it. .
John Woodruff Simpson fellow.
© The Authors 2024
 Open Access article, published by EDP Sciences, under the terms of the Creative Commons Attribution License (https://creativecommons.org/licenses/by/4.0), which permits unrestricted use, distribution, and reproduction in any medium, provided the original work is properly cited.
This article is published in open access under the Subscribe to Open model. This email address is being protected from spambots. You need JavaScript enabled to view it. to support open access publication.
1. Introduction
Observational constraints indicate that the epoch of reionization (EoR) probably began around redshift z ∼ 10 − 15 and ended by z ∼ 6 (McGreer et al. 2015; Greig et al. 2017; Sobacchi & Mesinger 2015; Mason et al. 2019; Whitler et al. 2020; Wang et al. 2020; Nakane et al. 2024). It is believed that Lyman continuum radiation from early galaxies (Robertson et al. 2015) (with a possible contribution from emerging quasars; Madau & Haardt 2015) reionized the expanding gas following the so-called dark ages that began soon after recombination at t ∼ 380 000 years in the context of ΛCDM.
Ironically, the earliest attempts at understanding how reionization came about struggled to reconcile an apparent paucity of ionizing radiation at high redshifts with the timescale at which this process took place, beginning with cosmic microwave background (CMB) constraints from WMAP (Komatsu et al. 2011), then improving with newer CMB data from Planck (Planck Collaboration XIII 2016), and even from considerations (Melia & Fatuzzo 2016) of the alternative Friedmann-Lemaître-Robertson-Walker (FLRW) cosmology known as the Rh = ct universe (Melia 2007; Melia & Shevchuk 2012; Melia 2020), the principal focus of this paper.
But JWST completely reverses this picture, revealing a surprising number of well-formed galaxies at z approaching 14 and beyond, a mere few hundred Myr after the big bang–much earlier than expected in the context of ΛCDM. These first galaxies were prolific emitters of ionizing photons which, as we shall confirm shortly, produced far too much UV irradiation of the intergalactic medium (IGM) in the context of ΛCDM (Muñoz et al. 2024) to allow reionization to extend over the observed redshift range 15 ≳ z ≳ 6.
The incorrect evolutionary history implied by this finding represents a fourth strike delivered by JWST against the predictions of the standard model. Most glaringly, well-formed galaxies (Melia 2023a; López-Corredoira et al. 2024) and quasars (Melia 2024a) have been discovered well before structure formation should have begun in the early Universe, followed by the detection of polycyclic aromatic hydrocarbons (PAHs) at z = 6.71 (Witstok et al. 2023; Melia 2024b). These dust grains should have taken about 1 Gyr to form via the standard AGB channel, especially at low metallicities, yet they appear a mere ∼500 million years after the first stars are supposed to have formed in ΛCDM.
In this paper, we argue that all four of these significant problems consistently point to a single flaw in the standard model–its incorrect time versus redshift relation. We already know from earlier work (Melia 2023a, 2024b) that the timeline predicted by the Rh = ct universe eliminates the first three of these anomalies. But the motivation for considering whether this model might also mitigate the reionization crisis extends well beyond these results. In recent years, we have carried out numerous comparative tests between Rh = ct and ΛCDM, showing that the data tend to favor the former over the latter with a likelihood ∼90% versus ∼10%, based on over 30 different kinds of observations, at both high and low redshifts. A short summary of these publications may be found in Table 2 of Melia (2018), and a more complete description of the model’s fundamental origin and scientific justification may be seen in Melia (2020).
We begin by reanalyzing the standard reionization model in ΛCDM, solely for the purpose of establishing consistency with the pioneering work of Muñoz et al. (2024). We assume flat ΛCDM with h = 0.7, Ωm = 0.3 and Ωb = 0.0224/h2 to match previous fiducial models, and use AB magnitudes throughout (Oke & Gunn 1983). Our results fully confirm their conclusions, establishing a need to consider the alternative Rh = ct cosmology. Repeating the analysis for the timeline and geometry in Rh = ct, we find that both the reionization history and CMB optical depth in this model are well supported by the JWST and Planck data. We thereby conclude that the self-consistent resolution of all four anomalies uncovered by JWST via the replacement of ΛCDM with Rh = ct argues compellingly in favor of the latter as the correct cosmological model.
2. Standard reionization history
The three primary factors determining the conventional reionization history include: (i) the average ionizing photon emissivity, (ii) the fraction fesc of these photons escaping into the IGM, and (iii) the number of recombinations per hydrogen atom. The first of these is given by the abundance of galaxies at high z, expressed in terms of the UV luminosity function (UVLF), ΦUV, in units of the comoving number density of galaxies per UV magnitude, MUV, times the ionizing efficiency ξion of each galaxy. The new JWST observations show that early galaxies have higher ionizing efficiencies than previously assumed, with
 (1)
(1)
versus ∼25.2 (Atek et al. 2024; Simmonds et al. 2024; Endsley et al. 2023; Calabro et al. 2024). Following Muñoz et al. (2024), we shall conservatively cap ξion at z = 9 and MUV = −16.5 to avoid extrapolation.
The escape fraction in high-z galaxies is not well motivated theoretically, and difficult to measure while the IGM contains neutral hydrogen. Studies of reionization-galaxy analogues at low z find a strong correlation between fesc and the UV slopes, βUV, however, which provides a rough estimate (Flury et al. 2022; Chisholm et al. 2022; Begley et al. 2022). Based on these studies, the slopes of JWST galaxies imply that fesc ∼ 5 − 15% (Mascia et al. 2023; Lin et al. 2024).
We use the fit from Chisholm et al. (2022),
 (2)
(2)
where Af = 1.3 × 10⁻⁴ and bf = −1.22. This expression may be combined with the βUV − MUV measurements in Zhao & Furlanetto (2024), incorporating data from both JWST and HST (Bouwens et al. 2014; Topping et al. 2022; Cullen et al. 2023), to estimate fesc(MUV). The UV slopes are capped at βUV = −2.7 to avoid extrapolation, since these limits correspond to the bluest galaxies for which Equation (2) is calibrated.
The volume-averaged hydrogen ionized fraction, xHII = 1 − xHI, where xHI ≡ nHI/nH is the corresponding neutral fraction, evolves according to the equation (Madau et al. 1999)
 (3)
(3)
where ṅion is the rate of ionizing-photon production, nH = ρb(1 − YHe)/mHc2, YHe is the helium mass fraction, mH is the proton mass, and ρb is the baryon energy density.
The recombination timescale is given as (Shull et al. 2012)
![Mathematical equation: $$ \begin{aligned} t_{\rm rec}=\left[C\alpha _{\rm B}(1+x_{\rm He})n_{\rm H}\right]^{-1}, \end{aligned} $$](/articles/aa/full_html/2024/09/aa50835-24/aa50835-24-eq4.gif) (4)
(4)
where xHe ≡ nHe/nH ≈ YHe/[4(1 − YHe)] is the helium fraction, αB is the case-B recombination coefficient, and C is the clumping factor. We follow previous work setting C = 3 and evaluate αB at T = 2 × 10⁴ K.
The ionizing-photon production rate may be expressed as
 (5)
(5)
where the factor (1 + z)3 converts ΦUV into a density per unit proper volume, and the integral extends down to a cutoff magnitude that is essentially a free parameter, though its impact on the results is small. The directly observed galaxies extend down to magnitude MUV ∼ −15. If one includes galaxies much fainter than this, the implied escape fraction fesc would appear to be unrealistically small (Muñoz et al. 2024). In addition, one expects a turnover due to feedback (Shapiro et al. 2004), which seems to be confirmed by HST observations, with MUV ∼ 15 (Atek et al. 2018). In this paper, we therefore conservatively take the cutoff to be MUV = −14.6 in Rh = ct, and assume the same value for ΛCDM as well. Our result for the standard model, summarized in Figure 1 below, is thus somewhat less extreme than that of Muñoz et al. (2024), who instead integrate Equation (5) down to MUV = −13. The UVLF is taken from the pre-JWST fit in Bouwens et al. (2021) at z ≤ 9, and from Donnan et al. (2024) at z > 9. Lastly, Ṅion ≡ LUV ξion is the ionizing-photon production rate per galaxy, in terms of their UV luminosity LUV and ionizing efficiency ξion.
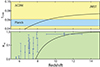 |
Fig. 1. Reionization history in ΛCDM based on new JWST observations of structure formation in the early Universe. Lower panel: the neutral fraction xHI as a function of redshift z, for a cutoff MUV = −14.6 and a JWST-calibrated ionizing efficiency, ξion, and escape fraction (fesc) inferred from low-z analogues. The blue data points represent measured observational constraints (see text for references). Upper panel: CMB optical depth, τCMB, as a function of z. The blue band represents the Planck measurement and its uncertainty (Planck Collaboration VI 2020). The |

Correspondingly, the reionization history is used to calculate the CMB optical depth,
 (6)
(6)
where R is proper distance, σT is the Thomson cross section, and
 (7)
(7)
is the proper electron number density, with α = 1 for z > 4 and α = 2 for z ≤ 4. For simplicity, we assume that HeI reionization tracks HI, and that HeII reionization occurs at z = 4.
The lower panel in Figure 1 shows the hydrogen neutral fraction as a function of z calculated from Equation (3) with xHII = 0 at z = 30, assuming ΛCDM as the correct cosmology. This theoretically predicted curve is compared with the data (blue points), taken from McGreer et al. (2015), Greig et al. (2017), Sobacchi & Mesinger (2015), Mason et al. (2019), Whitler et al. (2020), Wang et al. (2020), Nakane et al. (2024). The upper panel shows the corresponding CMB optical depth, along with the Planck measurement (blue): τCMB = 0.054 ± 0.007 (Planck Collaboration VI 2020).
We fully confirm the result, first presented by Muñoz et al. (2024), that the new JWST observations clearly imply a reionization history in ΛCDM ending at z ≳ 8. The disparity between the data and the predicted xHI(z) and τCMB(z) profiles creates significant tension for the standard model. In particular, note that the calculated CMB optical depth, τCMB ∼ 0.07, misses the Planck measurement by over 2σ, contributing to the so-called JWST reionization crisis.
Muñoz et al. (2024) extended their analysis beyond this point, principally to discuss all plausible physical mechanisms, theoretical and observational, that might resolve this photon budget anomaly. The outcome of that work, however, is that all of the exotic fixes attempted thus far are in conflict with at least one observational constraint. There is yet no known solution to this emerging problem with the standard model.
3. Reionization history in Rh = ct
Let us now take the opposite approach, assume that the astrophysics of reionization is basically correct, and instead redo the calculation for Rh = ct. There are several critical differences between the timeline and geometry of an Rh = ct universe and one driven by ΛCDM.
The first modification arises from the age-redshift relation. In ΛCDM, we have
 (8)
(8)
where, in keeping with our assumption of a flat Universe and dark energy in the form of a cosmological constant, we have simply ΩΛ = 1 − Ωm − Ωr. The corresponding expression for Rh = ct is
 (9)
(9)
As demonstrated elsewhere, e.g., Melia & Fatuzzo (2016), these relations show that the Universe is approximately the same age today in both models, but tRh is roughly twice tΛCDM at z ≳ 6. This is the reason, of course, why the Rh = ct universe completely eliminates the ‘too early’ galaxy and supermassive black hole problems.
In addition, the two models differ significantly in terms of geometry. The differential comoving distance at z in ΛCDM is given as
 (10)
(10)
while in Rh = ct it is
 (11)
(11)
Surprisingly, the two integrated comoving distances track each other rather closely up to z ∼ 8, but then deviate considerably towards higher redshifts. For example, the ratio of proper volumes at z = 15 is  .
.
Given these two principal differences between the two models, one should also expect variations in the parameters, such as H0 and Ωb, optimized to fit the full range of cosmological observations. But it turns out these differences are usually rather small, mainly because it appears that the formulation in ΛCDM, which was largely developed empirically, produces an expansion history mimicking that of Rh = ct. It is beyond the scope of the present work to carry out such detailed comparisons, which have actually already appeared in the literature, as one may see from Table 2 of Melia (2018). For simplicity (and transparency) in this paper, we shall therefore adopt the H0 and Ωb values optimized for ΛCDM.
Finally, to solve Equation (3) starting with xHII = 0 at z = 30, we also need to recalibrate the UVLF ΦUV in Equation (5), assembled for ΛCDM, to make it compatible with the proper volume differences,  , between ΛCDM and Rh = ct. The fits used for ΦUV(MUV, z) are loosely based on the predictions of ΛCDM and Rh = ct, but are largely empirical, as noted earlier, based on pre-JWST observations at z ≤ 9 (Bouwens et al. 2021) and JWST calibrations at z > 9 (Donnan et al. 2024). These expressions are inferred primarily from the observed number of galaxies as a function of MUV and z, and the density is then determined using a conversion of measured redshift to model-dependent comoving volume. The data are model independent, as they depend only on z. Previous work already confirms that the halo mass function may be formulated in a similar way in these two models (Yennapureddy & Melia 2019), the difference arising solely from a recalibration of the volumes. And this is confirmed by a detailed comparison of the matter power spectra in ΛCDM and Rh = ct, which fit the data equally well once the volume recalibration is taken into account (Yennapureddy & Melia 2021). Thus, the variation in ΦUV between the two models is due solely to the difference in their predicted volumes, and for the analysis in this paper, it is therefore sufficient to merely recalibrate the UV luminosity function used by Muñoz et al. (2024) via the change in comoving (or, equally, proper) volume from ΛCDM to Rh = ct.
The calculated hydrogen neutral fraction in Rh = ct is shown as a function of z in the lower panel of Figure 2. The corresponding CMB optical depth in this model is shown in the upper panel. All the other features in this figure are identical to those in Figure 1.
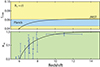 |
Fig. 2. Same as Fig. 1, except now for the Rh = ct cosmology and a cutoff MUV = −14.6. The |

Though we are not necessarily optimizing any model parameters in this paper, it is nevertheless helpful to assess how well each of the cosmologies fits the data in Figures 1 and 2. The (reduced)  of the fit based on the ΛCDM prediction (Fig. 1) is 4.36, while the calculated τCMB is 0.068, which differs from the Planck value by about 2σ. By comparison,
  for Rh = ct is 1.1 (Fig. 2), and τCMB ≈ 0.062, which agrees with Planck to within ∼1σ. Were we to use these outcomes as a basis for head-to-head model selection using, e.g., the Aikake Information Criterion (Akaike 1974; Melia & Maier 2013), we would infer a relative likelihood of ΛCDM being the correct cosmology of only ∼10−10 compared to ∼1 for Rh = ct, clearly implying solid support for the latter model by the reionization data.
4. Discussion and conclusion
The mitigation of the JWST reionization crisis, from a comparison of Figures 1 and 2, is quite evident and robust. It is essential to understand that only the cutoff in MUV for the integration in Equation (5) is somewhat undetermined, as described earlier. All one can say is that the cutoff must be ≥15, and could have a value extending perhaps to −12 or −13, as assumed by Muñoz et al. (2024). Of course, the larger this value is, the more serious the crisis becomes, because it enhances the UV irradiation of the IGM. We have here simply taken a conservative approach in using a cutoff as small as one could reasonably adopt based on the observations, in order to give ΛCDM the benefit of the doubt, so its value was not fine-tuned, but merely assumed to be somewhat below the observational constraints, i.e., −14.6. All the other factors used in this analysis, including fesc, ξion, ΦUV and so forth, are strictly fixed by the previous analyses.
It is thus rather easy to understand what solves the problem. By far, the most significant difference between the calculation of xHII(z) in ΛCDM and Rh = ct is the impact on the UVLF ΦUV of the proper volume. The Universe was larger at z ≳ 10 in Rh = ct than it would have been in ΛCDM. As a result, ΦUV(z) is smaller in the former than in the latter for the same number of galaxies observed at z. The UV-irradiation of the IGM was therefore less severe in Rh = ct, which lowered the reionization rate and thereby delayed the end of the reionization epoch (to z ∼ 6).
We have now witnessed at least four major discoveries by JWST in the early Universe that have created significant tension for ΛCDM. And while exotic fixes may be introduced to fix each of them individually, e.g., by proposing that supermassive black holes were created as ∼105 M⊙ seeds (Yoo & Miralda-Escudé 2004; Latif et al. 2013; Alexander & Natarajan 2014)–a process that has never been seen anywhere in the cosmos–eventually one must acknowledge the fact that a scenario in which a single modification simultaneously eliminates all of the anomalies ought to be given serious consideration as being the correct approach. Replacing ΛCDM with Rh = ct as the background cosmology certainly does this–and rather impressively–as we have seen in this paper.
Looking forward, the prospect of Rh = ct being the correct cosmology is quite alluring because it solves many, if not all, of the paradoxes and conflicts accumulated by the standard model. For example, it eliminates all horizon problems, including those associated with the CMB temperature and the Electroweak phase transition (Melia 2013, 2018). And it eliminates the cosmic entropy anomaly (Melia 2021), the monopole problem (Melia 2023b), and inflation’s violation of the strong energy condition in general relativity (Melia 2023c), among many others (Melia 2022a).
Finally, recent fundamental work with the FLRW metric itself demonstrates that the overly simplified FLRW ansatz, with a lapse function g00 = 1, may in fact be valid only for the zero active mass equation of state, ρ + 3p = 0, in terms of the total energy density ρ and pressure p, which produces the constant expansion rate in Rh = ct (Melia 2022b). In other words, Rh = ct may be the only valid FLRW solution consistent with the foundational symmetries in the Cosmological principle.
References
- Akaike, H. 1974, IEEE Trans. Autom. Control, 19, 716 [Google Scholar]
- Alexander, T., & Natarajan, P. 2014, Science, 345, 1330 [NASA ADS] [CrossRef] [Google Scholar]
- Atek, H., Richard, J., Kneib, J.-P., & Schaerer, D. 2018, MNRAS, 479, 5184 [Google Scholar]
- Atek, H., Labbé, I., Furtak, L. J., et al. 2024, Nature, 626, 975 [NASA ADS] [CrossRef] [Google Scholar]
- Begley, R., Cullen, F., McLure, R. J., et al. 2022, MNRAS, 513, 3510 [NASA ADS] [CrossRef] [Google Scholar]
- Bouwens, R. J., Bradley, L., Zitrin, A., et al. 2014, ApJ, 795, 126 [Google Scholar]
- Bouwens, R. J., Oesch, P. A., Stefanon, M., et al. 2021, AJ, 162, 47 [NASA ADS] [CrossRef] [Google Scholar]
- Calabro, A., Castellano, M., Zavala, J. A., et al. 2024, ApJ, submitted [arXiv:2403.12683] [Google Scholar]
- Chisholm, J., Saldana-Lopez, A., Flury, S., et al. 2022, MNRAS, 517, 5104 [CrossRef] [Google Scholar]
- Cullen, F., McLure, R. J., McLeod, D. J., et al. 2023, MNRAS, 520, 14 [NASA ADS] [CrossRef] [Google Scholar]
- Donnan, C. T., McLure, R. J., Dunlop, J. S., et al. 2024, MNRAS, submitted [arXiv:2403.03171] [Google Scholar]
- Endsley, R., Stark, D. P., Whitler, L., et al. 2023, MNRAS, 524, 2312 [NASA ADS] [CrossRef] [Google Scholar]
- Flury, S. R., Jaskot, A. E., Ferguson, H. C., et al. 2022, ApJS, 260, 1 [NASA ADS] [CrossRef] [Google Scholar]
- Greig, B., Mesinger, A., Haiman, Z., & Simcoe, R. A. 2017, MNRAS, 466, 4239 [Google Scholar]
- Komatsu, E., Smith, K. M., Dunkley, J., et al. 2011, ApJS, 192, 18 [Google Scholar]
- Latif, M. A., Schleicher, D. R. G., Schmidt, W., & Niemeyer, J. 2013, MNRAS, 433, 1607 [NASA ADS] [CrossRef] [Google Scholar]
- Lin, Y.-H., Scarlata, C., Williams, H., et al. 2024, MNRAS, 527, 4173 [Google Scholar]
- López-Corredoira, M., Melia, F., Wei, J.-J., & Gao, C.-Y. 2024, ApJ, 970, 63 [CrossRef] [Google Scholar]
- Madau, P., & Haardt, F. 2015, ApJ, 813, L8 [Google Scholar]
- Madau, P., Haardt, F., & Rees, M. J. 1999, ApJ, 514, 648 [CrossRef] [Google Scholar]
- Mascia, S., Pentericci, L., Calabrò, A., et al. 2023, A&A, 672, A155 [NASA ADS] [CrossRef] [EDP Sciences] [Google Scholar]
- Mason, C. A., Fontana, A., Treu, T., et al. 2019, MNRAS, 485, 3947 [NASA ADS] [CrossRef] [Google Scholar]
- McGreer, I. D., Mesinger, A., & D’Odorico, V. 2015, MNRAS, 447, 499 [NASA ADS] [CrossRef] [Google Scholar]
- Melia, F. 2007, MNRAS, 382, 1917 [NASA ADS] [CrossRef] [Google Scholar]
- Melia, F. 2013, A&A, 553, A76 [NASA ADS] [CrossRef] [EDP Sciences] [Google Scholar]
- Melia, F. 2018, MNRAS, 481, 4855 [CrossRef] [Google Scholar]
- Melia, F. 2020, The Cosmic Spacetime (Oxford: Taylor and Francis) [CrossRef] [Google Scholar]
- Melia, F. 2021, Eur. Phys. J. C, 81, 234 [NASA ADS] [CrossRef] [Google Scholar]
- Melia, F. 2022a, PASP, 134, 121001 [Google Scholar]
- Melia, F. 2022b, Mod. Phys. Lett. A, 37, 2250016 [NASA ADS] [CrossRef] [Google Scholar]
- Melia, F. 2023a, MNRAS, 521, L85 [CrossRef] [Google Scholar]
- Melia, F. 2023b, Phys. Dark Univ., 42, 101329 [NASA ADS] [CrossRef] [Google Scholar]
- Melia, F. 2023c, Ann. Phys., 535, 2300157 [NASA ADS] [CrossRef] [Google Scholar]
- Melia, F. 2024a, MNRAS, submitted [Google Scholar]
- Melia, F. 2024b, Phys. Dark Univ., 46, 101587 [NASA ADS] [CrossRef] [Google Scholar]
- Melia, F., & Fatuzzo, M. 2016, MNRAS, 456, 3422 [NASA ADS] [CrossRef] [Google Scholar]
- Melia, F., & Maier, R. S. 2013, MNRAS, 432, 2669 [NASA ADS] [CrossRef] [Google Scholar]
- Melia, F., & Shevchuk, A. S. H. 2012, MNRAS, 419, 2579 [NASA ADS] [CrossRef] [Google Scholar]
- Muñoz, J. B., Mirocha, J., Chisholm, J., Furlanetto, S. R., & Mason, C. 2024, MNRAS, submitted [arXiv:2404.07250] [Google Scholar]
- Nakane, M., Ouchi, M., Nakajima, K., et al. 2024, ApJ, 967, 28 [NASA ADS] [CrossRef] [Google Scholar]
- Oke, J. B., & Gunn, J. E. 1983, ApJ, 266, 713 [NASA ADS] [CrossRef] [Google Scholar]
- Planck Collaboration XIII. 2016, A&A, 594, A13 [NASA ADS] [CrossRef] [EDP Sciences] [Google Scholar]
- Planck Collaboration VI. 2020, A&A, 641, A6 [NASA ADS] [CrossRef] [EDP Sciences] [Google Scholar]
- Robertson, B. E., Ellis, R. S., Furlanetto, S. R., & Dunlop, J. S. 2015, ApJ, 802, L19 [Google Scholar]
- Shapiro, P. R., Iliev, I. T., & Raga, A. C. 2004, MNRAS, 348, 753 [NASA ADS] [CrossRef] [Google Scholar]
- Shull, J. M., Harness, A., Trenti, M., & Smith, B. D. 2012, ApJ, 747, 100 [CrossRef] [Google Scholar]
- Simmonds, C., Tacchella, S., Hainline, K., et al. 2024, MNRAS, 527, 6139 [Google Scholar]
- Sobacchi, E., & Mesinger, A. 2015, MNRAS, 453, 1843 [Google Scholar]
- Topping, M. W., Stark, D. P., Endsley, R., et al. 2022, ApJ, 941, 153 [NASA ADS] [CrossRef] [Google Scholar]
- Wang, F., Davies, F. B., Yang, J., et al. 2020, ApJ, 896, 23 [NASA ADS] [CrossRef] [Google Scholar]
- Whitler, L., Mason, C., Ren, K., & Conroy, C. 2020, Am. Astron. Soc. Meet. Abstr., 235, 207.04 [NASA ADS] [Google Scholar]
- Witstok, J., Shivaei, I., Smit, R., et al. 2023, Nature, 621, 267 [CrossRef] [Google Scholar]
- Yennapureddy, M. K., & Melia, F. 2019, Eur. Phys. J. C, 79, 571 [NASA ADS] [CrossRef] [Google Scholar]
- Yennapureddy, M. K., & Melia, F. 2021, Phys. Dark Univ., 31, 100752 [NASA ADS] [CrossRef] [Google Scholar]
- Yoo, J., & Miralda-Escudé, J. 2004, ApJ, 614, L25 [NASA ADS] [CrossRef] [Google Scholar]
- Zhao, J., & Furlanetto, S. R. 2024, JCAP, submitted [arXiv:2401.07893] [Google Scholar]
All Figures
|
Fig. 1. Reionization history in ΛCDM based on new JWST observations of structure formation in the early Universe. Lower panel: the neutral fraction xHI as a function of redshift z, for a cutoff MUV = −14.6 and a JWST-calibrated ionizing efficiency, ξion, and escape fraction (fesc) inferred from low-z analogues. The blue data points represent measured observational constraints (see text for references). Upper panel: CMB optical depth, τCMB, as a function of z. The blue band represents the Planck measurement and its uncertainty (Planck Collaboration VI 2020). The |
| In the text | |
|
Fig. 2. Same as Fig. 1, except now for the Rh = ct cosmology and a cutoff MUV = −14.6. The |
| In the text | |
Current usage metrics show cumulative count of Article Views (full-text article views including HTML views, PDF and ePub downloads, according to the available data) and Abstracts Views on Vision4Press platform.
Data correspond to usage on the plateform after 2015. The current usage metrics is available 48-96 hours after online publication and is updated daily on week days.
Initial download of the metrics may take a while.