| Issue |
A&A
Volume 697, May 2025
|
|
|---|---|---|
| Article Number | A211 | |
| Number of page(s) | 10 | |
| Section | Extragalactic astronomy | |
| DOI | https://doi.org/10.1051/0004-6361/202449331 | |
| Published online | 19 May 2025 | |
UNCOVERing the contribution of black holes to reionization
1
Kapteyn Astronomical Institute, University of Groningen, PO Box 800 9700 AV Groningen, The Netherlands
2
Institut d’Astrophysique de Paris, CNRS, Sorbonne Université, 98bis Boulevard Arago, 75014 Paris, France
3
Department of Astrophysical Sciences, Princeton University, 4 Ivy Lane, Princeton, NJ 08544, USA
4
NSF’s National Optical-Infrared Astronomy Research Laboratory, 950 North Cherry Avenue, Tucson, AZ 85719, USA
5
Physics Department, Ben-Gurion University of the Negev, P.O. Box 653 Be’er-Sheva 84105, Israel
6
Department of Physics & Astronomy and PITT PACC, University of Pittsburgh, Pittsburgh, PA 15260, USA
7
Department of Astrophysics, University of Zurich, Winterthurerstrasse 190, 8057 Zurich, Switzerland
8
Centre for Astrophysics and Supercomputing, Swinburne University of Technology, PO Box 218 Hawthorn, VIC 3122, Australia
9
Department of Astronomy, University of Geneva, Chemin Pegasi 51, 1290 Versoix, Switzerland
10
Cosmic Dawn Center (DAWN), Niels Bohr Institute, University of Copenhagen, Jagtvej 128, København N DK-2200, Denmark
11
Department of Astronomy, University of Massachusetts Amherst, Amherst, MA 01003, USA
⋆ Corresponding author: This email address is being protected from spambots. You need JavaScript enabled to view it.
Received:
24
January
2024
Accepted:
20
February
2025
Abstract
Context. With its sensitivity in the rest-frame optical, the James Webb Space Telescope (JWST) has uncovered active galactic nuclei (AGN), which comprise intrinsically faint and heavily reddened sources, well into the first billion years of the Universe, at z ∼ 4 − 11.
Aims. We revisit the AGN contribution to reionization given the high number densities associated with these objects.
Methods. We used the DELPHI semi-analytic model, which we base-lined against the latest high-redshift datasets from the JWST and the Atacama Large millimetre Array (ALMA) to model early star-forming galaxies and AGN. We calculated the escape fractions of ionizing radiation from star formation and AGN and included the impact of reionization feeback in suppressing the baryonic content of low-mass galaxies in ionized regions. This model was validated against the key observables for star-forming galaxies, AGN, and reionization.
Results. In our fiducial model, reionization reaches its mid-point at z ∼ 6.9 and ends by z ∼ 5.9. Low stellar mass (M* ≲ 109 M⊙) star-forming galaxies are found to be the key drivers of the reionization process. They provide about 77% of the total photon budget. Despite their high numbers, high accretion rates, and higher escape fractions than star-forming galaxies at z ∼ 5, AGN only provide about 23% of the total reionization budget, which is dominated by black holes in high stellar mass systems (with M* ≳ 109 M⊙). This is because AGN number densities become relevant only at z ≲ 7, and as a result, AGN contribute as much as galaxies as late as z ∼ 6.2, when reionization is already in its end stages. Finally, we find that even contrasting models of the AGN ionizing photon escape fraction (increasing or decreasing with stellar mass) do not qualitatively change our results.
Key words: galaxies: high-redshift / quasars: general / cosmology: theory / dark ages / reionization / first stars
© The Authors 2025
 Open Access article, published by EDP Sciences, under the terms of the Creative Commons Attribution License (https://creativecommons.org/licenses/by/4.0), which permits unrestricted use, distribution, and reproduction in any medium, provided the original work is properly cited.
This article is published in open access under the Subscribe to Open model. This email address is being protected from spambots. You need JavaScript enabled to view it. to support open access publication.
1. Introduction
The progress of reionization and its key sources remain outstanding questions in the field of physical cosmology. This is because the process of reionization depends on a number of poorly understood quantities, including the abundance of galaxies in the first billion years, their star formation and black hole accretion rates that determine the production rate of ionizing photons, the fraction of such photons that can escape from the galactic environment into the intergalactic medium (IGM), and the (spatially and temporally varying) clumping factor of the IGM that determines the recombination rate, to name a few (for reviews see e.g. Dayal & Ferrara 2018; Robertson 2022).
A consensus has been growing that low-mass galaxies are the most probable drivers of the reionization process because their number densities show a rising trend down to absolute magnitudes as faint as MUV ∼ −15 (e.g. Robertson et al. 2015; Madau 2017; Dayal et al. 2020; Trebitsch et al. 2022; Atek et al. 2024; Rinaldi et al. 2024). Black holes seem to contribute at most a few tens of a percent to the reionization process, mostly in its end stages at z ≲ 5 (e.g. Onoue et al. 2017; Dayal et al. 2020; Trebitsch et al. 2023). However, these results crucially depend on the number density of active galactic nuclei (AGN), especially in intermediate-mass halos (given that black hole accretion can produce ten times as many ionizing photons as star formation per unit baryon) in addition to the escape fraction of ionizing photons from these sources (e.g. Dayal et al. 2020). Before the advent of the James Webb Space Telescope (JWST), a number of observations (e.g. Giallongo et al. 2015; Boutsia et al. 2018; Giallongo et al. 2019; Fujimoto et al. 2022) had already indicated a higher-than-expected number density of faint AGN at z > 4, although these results remained highly debated (McGreer et al. 2018; Parsa et al. 2018; Akiyama et al. 2018). The proposal was that these number densities holding up to higher redshifts might imply a significant AGN contribution to the reionization process (e.g. Grazian et al. 2018; Mitra et al. 2018). Overall, the relative importance of star-forming galaxies and AGN to reionization has remained a key outstanding issue that is mostly driven by a lack of statistically significant samples of black holes at z ≳ 6.
With its sensitivity, recent observations with the JWST have been crucial in shedding light on the AGN population at z ≳ 4, comprising both intrinsically faint (Harikane et al. 2023b; Maiolino et al. 2024a,b) and heavily reddened sources (“little red dots”; e.g. Labbé et al. 2023; Furtak et al. 2023, 2024; Kokorev et al. 2023, 2024; Greene et al. 2024; Matthee et al. 2024; Labbe et al. 2025). The detection of broadened hydrogen alpha (Hα) lines from deep JWST spectroscopy have been used to detect the ubiquitous presence of faint AGN at z ≳ 4 (Harikane et al. 2023b; Maiolino et al. 2024a,b). The JWST has also yielded a new population of little red dots (LRDs) that exhibit extremely small sizes (of about a few hundred parsecs) and a characteristic V-shaped continuum that is red in the rest-frame optical, but has a blue slope in the rest-frame ultraviolet (UV; Labbé et al. 2023; Labbe et al. 2025; Furtak et al. 2023). Spectroscopic follow-ups reveal clearly broadened Balmer lines that were used to infer the presence of accreting black holes (e.g. Furtak et al. 2024; Kokorev et al. 2023, 2024; Fujimoto et al. 2024; Greene et al. 2024; Matthee et al. 2024; Kocevski et al. 2023; Übler et al. 2023). While they account for a few percent of the galaxy population at z > 5, these relatively faint AGN seem to account for about 20% of broad-line selected AGN at z ∼ 5 − 6 (Harikane et al. 2024; Maiolino et al. 2024b). These combined observations have been used to infer black hole masses ranging between 106.5 − 8 M⊙ (Harikane et al. 2024; Maiolino et al. 2024a,b; Kocevski et al. 2023; Furtak et al. 2024; Larson et al. 2023; Bogdán et al. 2024; Goulding et al. 2023; Kokorev et al. 2023, 2024).
We revisit the black hole contribution to reionization in light of these newly detected AGN well within the first billion years. In addition to new modes of black hole seeding and growth required to match the JWST observations, this model, called DELPHI-DUSTBH, includes all of the relevant dust processes and was base-lined against the latest dust observations from the Atacama Large millimetre Array (ALMA) surveys at z ∼ 5 − 7 (Béthermin et al. 2020; Bouwens et al. 2022). This is particularly crucial because observationally, the escape fractions of ionizing photons from star-forming sources is closely linked to their dust enrichment (e.g. Chisholm et al. 2022). We start by describing the semi-analytic model we used for this analysis in Sect. 2, the escape fractions of ionizing photons from star-forming galaxies and AGN in Sect. 2.1, and the reionization-feedback weighted emissivity in Sect. 2.2. We then validate the model by comparing it to the ultraviolet luminosity function (UV LF) in Sect. 3.1 before we discuss the emissivity and escape fractions from galaxies and AGN in Sect. 3.2. We validate the model in Sect. 3.3, detail the contribution of galaxies and AGN to reionization in Sect. 3.4, and explore the cumulative AGN contribution for two different models of black hole escape fractions in Sect. 3.5 before we conclude in Sect. 4.
We adopted a ΛCDM model with dark energy, dark matter, and baryonic densities in units of the critical density as ΩΛ = 0.673, Ωm = 0.315, and Ωb = 0.049, respectively, a Hubble constant H0 = 100 h km s−1 Mpc−1 with h = 0.673, a spectral index n = 0.96, and a normalization σ8 = 0.81 (Planck Collaboration VI 2020). Throughout this work, we use a Salpeter initial mass function (IMF; Salpeter 1955) between 0.1 − 100 M⊙. Finally, we quote all quantities in comoving units, unless stated otherwise, and we express all magnitudes in the standard AB system (Oke & Gunn 1983).
2. Theoretical model
This work is based on using the DELPHI (Dark Matter and the emergence of galaxies in the epoch of reionization) semi-analytic model for galaxy formation, which uses a binary merger-tree approach to jointly track the build-up of dark matter halos, their baryonic components (gas, stellar, dust, and metal masses), and black holes. This version, which tracks the seeding and assembly of black holes driven by recent JWST observations, and the dust enrichment of early sources motivated by ALMA results, is called DELPHI-DUSTBH. It follows the assembly of dark matter halos between log(Mh/M⊙) = 8 − 14 from z ∼ 40 down to z = 4.5 in time-steps of 30 Myr. At any time-step, the available gas mass (from mergers and accretion) can form stars with an effective star formation efficiency that is the minimum between the efficiency that produces enough type II supernova (SNII) energy to eject the remainder of the gas, and an upper maximum threshold (f*). The two free parameters concerning star formation are f* ∼ 10% and the fraction of SNII energy that can couple to gas (fw ∼ 7.5%). Their values were obtained by simultaneously matching the to the faint and bright ends of the Lyman break galaxy (LBG) UV LF at z ∼ 5 − 9, and to the dust-stellar mass relations obtained from the latest ALMA observations (Béthermin et al. 2020; Bouwens et al. 2022). The (about five times higher) value of f* here compared to our previous model DELPHI2019 (Dayal et al. 2019) is driven by dust attenuation, which plays a specially crucial role for high-mass systems. In this case, we required a higher star formation efficiency to match to the observed bright end of the UV LF (for details see Dayal et al. 2022; Mauerhofer & Dayal 2023). Further, every newly formed stellar population (i.e., newly formed stellar mass within a given time-step) was assumed to have an age of 2 Myr. This age was used in conjunction with its metallicity, which is tracked by our model, to calculate the ionizing photon production rate using the STARBURST99 (Leitherer et al. 1999) stellar population synthesis code.
Further, while the details of black hole physics (growth from accretion and instantaneous mergers, the associated feedback, and a radiative efficiency of ϵr = 10%) remain the same as in our previous works (Dayal et al. 2019, 2020), we now summarise the key new ingredients required to match to the AGN populations being observed by the JWST as detailed in Table 1.
Free model parameters.
-
Explaining the black hole masses inferred for a number of observed early black holes requires black hole seeds heavier than those from Population III stars, which have masses of about ∼150 M⊙ (as discussed in e.g. Kokorev et al. 2023; Furtak et al. 2024; Maiolino et al. 2024a; Natarajan et al. 2024), as used in our previous works (Dayal et al. 2019). We therefore seeded the starting halos of any merger tree at z ≳ 13 with heavy seeds of masses (randomly chosen) between 103 − 5 M⊙. Widespread seeds with masses ∼103 M⊙ can form in dense, massive stellar clusters through a number of pathways (for a review see Sect. 2.3.1, Amaro-Seoane et al. 2023), including dynamical interactions (e.g. Devecchi & Volonteri 2009), the runaway merger of stellar mass black holes (e.g Belczynski et al. 2002), or the growth of stellar mass black holes in conjunction with mergers (e.g. Leigh et al. 2013). They can grow to higher masses within the clusters (Alexander & Natarajan 2014). Additionally, seeds with masses at birth up to 105 M⊙ can form via supermassive star formation, which is sometimes referred to as direct-collapse black holes, although this mechanism produces a lower number of viable seeds (Dayal et al. 2019).
-
Our model includes a critical halo mass for efficient black hole accretion with a value that evolves with redshift as Mbhcrit(z) = 1011.25[Ωm(1 + z)3 + ΩΛ]−0.125, in which we included a scatter of 0.5 dex, motivated by the results of cosmological simulations (e.g. Bower et al. 2017). In order to explain the number density of JWST-detected AGN, we modified some of the parameters. Black holes are allowed a gas accretion rate of
![Mathematical equation: $ {M_{\text{bh}}^{\text{ac}}}(z) = min[\epsilon_r {f_{\text{bh}}^{\text{ac}}}M_{\mathrm{g}}^{\mathrm{sf}}, {f_{\text{Edd}}}{M_{\text{Edd}}}] $](/articles/aa/full_html/2025/05/aa49331-24/aa49331-24-eq5.gif) , where
, where  is the gas mass left after star formation and its associated SNII feedback, fEdd is the Eddington fraction, and MEdd is the Eddington accretion rate. Allowing very weak AGN feedback (0.01% of black hole feedback coupling to the gas), we required values of fbhac = 0.1 (5 × 10⁻⁴) and fEdd = 1.0 (10−4) for halos above (below) the critical mass (we allowed 0.5 dex of scatter on all of these quantities). That is, black holes in high-mass (low-mass) halos can accrete the minimum between 10% (0.05%) of the available gas mass and 100% (0.01%) of the Eddington fraction. High-gas accretion rates in halos above the critical halo mass are crucial to simultaneously match AGN observables, including the bolometric and UV LFs, and black hole mass functions.
 -
We included the impact of dust attenuation on the luminosity and ionizing photon-escape fractions for the star formation and AGN, as detailed in Sect. 2.1.
-
Finally, we accounted for a coupling of reionization feedback and galaxy formation in order to determine the role of star formation and AGN in the reionization process, as detailed in Sect. 2.2.
2.1. Dust and the escape fraction of ionizing photons
The escape fraction of ionizing photons from star-forming galaxies and AGN remain a key outstanding issue in the field of reionization (e.g. Sect. 7.1, Dayal & Ferrara 2018). We used simple phenomenological prescriptions to obtain the escape fraction from star formation (fescsf) and AGN (fescbh). For star-forming galaxies (as in our previous work, Trebitsch et al. 2022), we used the results from the Low-z Lyman Continuum survey (LzLCS Flury et al. 2022), which targets 66 z ∼ 0.3 Lyman-continuum emitters that can be treated as analogs of early sources. For this sample, fescsf is closely linked to the UV spectral slope (β) between 1300–1800 Å, as characterized by Chisholm et al. (2022),
 (1)
(1)
Further, high-z observations (e.g. Bouwens et al. 2014) show a correlation between the β slope and the observed (dust-attenuated) UV magnitude such that (see e.g. Trebitsch et al. 2022)
 (2)
(2)
The above relations imply an increase in fescsf with a decrease in dust attenuation i.e. with bluer β slopes. We calculate the dust attenuated magnitude for star-forming galaxies using the model detailed in Dayal et al. (2022). Essentially, we use the latest metal yields from Kobayashi et al. (2020) and calculate the dust mass including the key processes of dust formation, destruction, ejection, astration and grain growth in the interstellar medium (ISM); we assume a grain growth timescale of 30 Myr timescale. This has been shown to yield results in accord with the latest ALMA observations for z ≳ 5 galaxies (Dayal et al. 2022; Mauerhofer & Dayal 2023). This dust is assumed to be perfectly mixed with the gas in order to calculate the optical depth to UV photons to obtain the dust-attenuated UV magnitude.
For the dust attenuation of black holes, we used results from zoom-in simulations that estimated the column density of gas around black holes in high-redshift galaxies (Trebitsch et al. 2019). These simulations found that the gas density in the central region of galaxies (∼40 pc), which dominates the total column density from the AGN to the galaxy edge, is modulated by inflows and outflows, leading to a scaling of the form
 (3)
(3)
This does not include an explicit torus. However, given the high gas content in high-z galaxies, the ISM column density is a significant, if not dominant, component (see Circosta et al. 2019). Assuming a scatter of 0.5 dex on this relation, we used the inferred column density to calculate the UV optical depth as τbh(λ) = ∫ndσd(λ)dl, where nd is the number density of dust grains, and σd is the dust interaction cross-section per unit hydrogen atom using the fits from Gnedin et al. (2008) based on the Small Magellanic Cloud (SMC) model. Further, because we only modeled the total gas, dust and metal masses in our model, we assumed the dust number density to be nd = ng(Z/Z⊙), where ng is the number density of gas particles, and Z is the gas phase metallicity normalized to the mean SMC metallicity of Z⊙ = 0.005. We then assumed the same escape fraction for UV and ionizing photons from AGN, such that fescbh = e−τbh.
2.2. Progress of reionization and its impact on galaxy formation
We calculated the volume-filling fraction of ionized hydrogen (QII) to track the progress of reionization as (Shapiro & Giroux 1987; Madau et al. 1999; Dayal et al. 2020)
 (4)
(4)
Here,  is the total escaping rate of ionizing photons (from star formation and AGN), nH is the comoving hydrogen number density, and trec is the recombination timescale for ionized hydrogen. We used an IGM clumping factor of C = 1 + 43 z−1.71 (Pawlik et al. 2009) to calculate trec (for complete details see Dayal et al. 2020).
The build-up of the heating UV background (UVB) from reionization can suppress the baryonic content of low-mass halos in ionized regions (e.g. Gnedin 2000; Sobacchi & Mesinger 2013; Hutter et al. 2021). We accounted for this process by running a maximum UVB scenario in which we completely suppressed the gas mass (and the associated star formation and black hole accretion rate) for halos with virial velocities below 50 Km s−1; this corresponds to halo masses of 109.7 (109.3) M⊙ at z ∼ 5 (10). The total emerging ionizing emissivity for reionization was then obtained by weighting over the UV-suppressed contribution from low-mass halos in ionized regions (QII) as well as that from nonsuppressed sources in neutral regions (QI = 1 − QII), such that (Choudhury & Dayal 2019)
![Mathematical equation: $$ \begin{aligned} \dot{n}_{\rm ion}(z)&= f_{\rm esc}^\mathrm{sf}[Q_{\rm II}(z) \dot{n}_{\rm int,II}^\mathrm{sf}(z) + Q_{\rm I}(z) \dot{n}_{\rm int,I}^\mathrm{sf}(z) ] \nonumber \\&\quad + f_{\rm esc}^\mathrm{bh}[Q_{\rm II}(z) \dot{n}_{\rm int,II}^\mathrm{bh}(z) + Q_{\rm I}(z) \dot{n}_{\rm int,I}^\mathrm{bh}(z)], \end{aligned} $$](/articles/aa/full_html/2025/05/aa49331-24/aa49331-24-eq12.gif) (5)
(5)
where the first and second terms on the right side account for the contribution of star-forming galaxies and AGN, respectively. As might be expected, while nonsuppressed halos dominate at the start of the reionization process, the importance of the UV-suppressed term increases as reionization proceeds. This is the fiducial model that was used throughout the paper.
3. Early black holes and the reionization process in light of JWST data
We validate our model against the UV LF for tje star-forming galaxies and AGN in Sect. 3.1 before we discuss their associated ionizing emissivities and escape fractions in Sect. 3.2. We validate the model against key reionization observables in Sect. 3.3 and discuss the key reionization sources in Sect. 3.4 before we conclude by showing the AGN contribution for two contrasting models of fescbh in Sect. 3.5.
3.1. UV LF for star-forming galaxies and AGN
We start by discussing the dust-attenuated UV LF from star-forming galaxies, AGN, and the total UV luminosity (summed over both these components), as shown in Fig. 1. As noted, our choice of the model parameters for star formation (maximum threshold star formation efficiency and the fraction of SN energy coupling to gas) and dust (consistent with our previous works, e.g. Dayal et al. 2022) were tuned to match the observed UV LF for LBGs at z ∼ 5 − 9 and for AGN at z ∼ 5 − 7 in addition to the stellar and black hole mass functions and the AGN bolometric LF. Therefore, by construction, the model yielded a dust-attenuated LBG UV LF that agreed well with the observations (including those from the JWST), within the error bars, for MUV ∼ −16 to −23.5 at z ∼ 5 − 7. This also naturally resulted in derived quantities such as the UV luminosity density being in accord with observations (for complete details see e.g. Dayal et al. 2022; Mauerhofer & Dayal 2023).
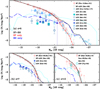 |
Fig. 1. Rest-frame UV LF at z ∼ 5, 7, and 10, as marked. In each panel, the long-dashed, dot-dashed, and solid lines show the dust-obscured UV LF for AGN, star formation, and the total luminosity, as marked; the dotted cyan lines show the intrinsic (i.e., not dust-attenuated) AGN UV LF. In all panels, points show observational results as marked: at z ∼ 5 (panel a), for star-forming galaxies (solid circles, Finkelstein et al. 2015; Bouwens et al. 2021), galaxies+AGN (empty circles, Harikane et al. 2022), AGN (empty stars and crosses, Giallongo et al. 2015; Parsa et al. 2018; Niida et al. 2020), and the new JWST AGN results from Matthee et al. (2024, filled hexagons), Maiolino et al. (2024b, empty squares), Harikane et al. (2024, filled triangles), (empty triangles; Scholtz et al. in prep.), Greene et al. (2024, filled squares) and Kokorev et al. (2024, empty hexagons). At z ∼ 7 (panel b), we show the results for star-forming galaxies (solid circles, Bowler et al. 2020; Bouwens et al. 2021), galaxies+AGN (empty circles, Harikane et al. 2022), and the new JWST AGN results from Greene et al. (2024, filled squares) and Kokorev et al. (2024, empty hexagons). At z ∼ 10 (panel c), we show the UV LF inferred for star-forming galaxies (solid circles, Oesch et al. 2018; Bouwens et al. 2021; Donnan et al. 2023; Harikane et al. 2023a; McLeod et al. 2024). At this redshift, the empty hexagons show AGN candidates (UHZ1 and GN-z11), with the number densities calculated as detailed in Fujimoto et al. (2024). |
The same figure shows that our model for AGN dust attenuation yields an evolving UV LF that agrees well with JWST observations of LRDs and faint AGN (with MUV ∼ −18 to −21.5) at z ∼ 5 (Matthee et al. 2024; Maiolino et al. 2024b,a; Harikane et al. 2024) and the UV LF at z ∼ 5 − 7 from Greene et al. (2024); our results also agree with earlier AGN UV LF estimates (e.g. Giallongo et al. 2015; Parsa et al. 2018). However, the model overpredicts the AGN UV LF between MUV ∼ −23 to −24 as compared to the observations from Niida et al. (2020). This is possibly due to the combination of a simple model for dust attenuation, a mass-independent black hole accretion rate, and an upscattering of low-mass black holes into these high-luminosity bins due to the scatter of 0.5 dex assumed on all of the model parameters. A further possibility is that pre-JWST observations may underestimate the bright end of the AGN UV LF. The UV luminosity functions are generally based on spectroscopically confirmed sources from photometrically selected samples, and they might therefore be incomplete. We also recall that in some cases, the AGN signatures are detected in the rest-frame optical, and we have incomplete knowledge of the origin of the UV emission, which may therefore have a significant contribution from the stellar component. In the case of the little red dots, we still do not know the origin of the UV (e.g. Labbe et al. 2025; Furtak et al. 2023; Greene et al. 2024). Finally, for the X-ray selected sources without spectroscopic follow-up, we do not know the unobscured/obscured fractions (e.g. Giallongo et al. 2015; Parsa et al. 2018).
We find that star formation dominates the faint-to-intermediate end (MUV ≳ −21.5) of the deconstructed UV LF at z ∼ 5, with AGN dominating at brighter luminosities (see also Ono et al. 2018; Piana et al. 2022). We find that UV-faint AGN contribute ∼0.4 − 15% to the total number density at intermediate luminosities (MUV ∼ −18 to −21) at this redshift. By z ∼ 7, AGN dominate the UV LF at much brighter luminosities corresponding to MUV ∼ −23. This is naturally expected as both the number densities and masses of massive black holes build up with time. As seen, we find that the intrinsic (dust-unattenuated) AGN UV LF severely overestimates the bright end of the AGN UV LF. An increasing impact of dust attenuation with decreasing redshift is crucial for a match of the AGN UV LF to observations.
The stellar component dominates the UV at all magnitudes at z ∼ 10, where massive black holes have not yet been able to assemble in significant numbers. At z ∼ 10, the AGN UV LF predicted by the model is lower by a factor 15–40 for the number densities of AGN inferred from UHZ1, and GN-z11 correctly represents the AGN population at this redshift (Fujimoto et al. 2024). We caution, however, that the nature of these two sources is poorly known. It is indeed highly plausible that the observed UV luminosity has a significant contribution from star formation and is not powered by AGN accretion alone. Within the error bars, these observed number densities agree with the intrinsic (i.e., dust-unattenuated) AGN UV LF from our model. If we were to account for these objects and assumed an upper limit of fescbh = 1, we would obtain the maximum AGN contribution to reionization. The results of this model are discussed in Sect. 3.4, where we show that this model can be ruled out because it severely overshoots the observed emissivity constraints at z ≲ 6.
3.2. Ionizing emissivity and its escape fraction from star formation and black holes
We now discuss the intrinsic production rate of ionizing photons as a function of stellar mass from star-forming galaxies ( ) and AGN (
 ) at z ∼ 5 − 10, as shown in panel a of Fig. 2. We find that ṅint scales with M* at all z ∼ 5 − 10 because in our model, the stellar mass assembly and the instantaneous star formation rate are closely tied to the underlying halo potential. The mean relation for star formation can be described by
  , where δ = (45.9, 46.3, 46.6) at z ∼ (5, 7, 10), respectively. The amplitude of the relation increases with redshift because galaxies of a given stellar mass are hosted in halos of similar masses at all z ∼ 5 − 10. However, halos of a given mass correspond to deeper potentials with increasing redshift, which results in an increase in the star formation rate and therefore an increase in the production rate of ionizing photons. The behavior of AGN is more mass-dependent (see e.g. Dayal et al. 2020): For example, at z ∼ 5,
  essentially scales with the stellar mass for M* ∼ 108 − 10 M⊙ galaxies, and it flattens thereafter out to M* ∼ 1012 M⊙. This is driven by the fact that although high-mass galaxies have an availability of gas, the black hole can only accrete the minimum between 10% of the gas mass and 100% of the Eddington limit, as discussed in Sect. 2. At z ∼ 5,
  exceeds
  for M* ≳ 109.2 − 11.4 M⊙ galaxies. For M* ∼ 1010 M⊙ systems, black holes produce about five times as many ionizing photons (
 ) as star formation. The same qualitative behavior persists at z ∼ 7, where black holes contribute roughly equally as star formation to the ionizing photon production rate for M* ∼ 1010 − 11 M⊙ galaxies, which is about
  . At z ∼ 10, however, black holes that are massive enough have not had time to assemble, as a result of which the stellar component dominates the ionizing photon production rate for all stellar masses.
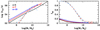 |
Fig. 2. Intrinsic production rate of ionizing photons as a function of the stellar mass (left panel) and their escape fractions (right panel) at z ∼ 5 − 10, as marked. In each panel, the solid and dashed lines show the results for star formation and black holes, respectively. |
We then discuss the trend of the escape fraction of ionizing photons from star formation and AGN as shown in panel b of the same figure. Because its direct dependence on the dust mass, which increases with M*, fescsf also decreases with an increase in the stellar mass. For example, at z ∼ 5 fescsf, decreases from about 16% for M* ∼ 107 M⊙ to ∼0.6% for M* ∼ 1012 M⊙. For a given stellar mass, the slight decrease in the dust attenuation with increasing redshift results in a mild increase in fescsf with z. For example, fescsf increases from 2.5% to 5% for M* ∼ 109 M⊙ between z ∼ 5 and 10. As for AGN, black holes in galaxies with M* ≲ 108.5 M⊙ show fescbh ≳ 80% because of their low Eddington accretion rates. We find that fescbh shows a steep drop for more massive systems due to an increase in both the Eddington accretion rate and metallicity, which drive up the dust optical depth. For example, by M* ∼ 1010 M⊙, fescbh drops to about 15% at z ∼ 5 − 7. We caution that this simple phenomenological model assumes spherical symmetry in calculating the escape fraction of ionizing photons from star formation and AGN. In principle, however, there might be (dusty) dust-free lines of sight that would result in much (lower) higher escape fractions.
3.3. Validating the model against reionization observables
We now validate the model results against the two key reionization observables, that is, the electron-scattering optical depth (τes) and QII, whose results are shown in Fig. 3. The model agreement with the early star-forming galaxy population and fescsf values that scale inversely with the stellar mass and redshift result in a τes value that agrees well with the central value inferred from Planck Collaboration VI (2020) data, as shown in the left panel of Fig. 3; this result was expected based on our previous works, which used the DELPHI model for reionization (Dayal et al. 2020). Given their larger number densities and higher fescsf values, we find low-mass (M* ≲ 109 M⊙) star-forming galaxies to be the key drivers of the reionization process, with higher mass galaxies having a negligible contribution. We also find that black holes in high-mass galaxies (M* ≳ 109 M⊙) dominate the AGN contribution to reionization.
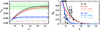 |
Fig. 3. Redshift evolution of the electron scattering optical depth (left panel) and the volume-filling fraction of ionizied hydrogen (right panel). We show the volume-filling fraction weighted values from star-forming galaxies and AGN as well as the contribution deconstructed into galaxies with stellar masses above and below 109 M⊙, as marked. In the left panel, the dot-dashed horizontal line and the shaded region show the electron-scattering optical depth and its associated error bars from Planck Collaboration VI (2020). In the right panel, points show compilations of QII results from a number of works (Fan et al. 2006; Davies et al. 2018; Yang et al. 2020a; Jung et al. 2020; Lu et al. 2020; Bosman et al. 2022; Gaikwad et al. 2023; Nakane et al. 2024). |
The right panel of the same figure shows that the contribution from star formation and AGN results in a redshift evolution of QII that agrees well with a number of observational results within the error bars (e.g. Fan et al. 2006; Davies et al. 2018; Yang et al. 2020b; Jung et al. 2020; Lu et al. 2020; Bosman et al. 2022; Gaikwad et al. 2023; Nakane et al. 2024); we also refer to Fontanot et al. (2023) for a tabulated compilation. In this fiducial model, reionization reaches its midpoint at z ∼ 6.9 and is over by zreio ∼ 5.9. Low-mass (M* ≲ 109 M⊙) star-forming galaxies are the key drivers of reionization for the bulk of its history (discussed further in Sect. 3.4). While a scenario without AGN shows no discernible effect on the progress of reionization down to z ∼ 7, the end of the process is delayed to z ∼ 5 (i.e., by about 200 Myr). In an AGN-only scenario, on the other hand, the redshift evolution of QII is naturally delayed, and the midpoint of reionization is reached at z ∼ 6. Driven by an increase in both the number densities and masses of black holes at z ≲ 6, reionization proceeds at an accelerated rate in this scenario and is over by z ∼ 5.2, driven mostly by AGN in high-mass (M* ≳ 109 M⊙) galaxies. An AGN-only scenario can be ruled out because it generates too low a value of τes = 0.032 (as compared to the observed value of 0.054) and differs from a number of inferred constraints on QII at z ≳ 7, as shown in the same figure.
We note that reionization ends at z ∼ 5.9 in our fiducial model, while recent results on the Lymanα transmission in quasar spectra seem to indicate that reionization-related fluctuations (in the UVB, residual neutral hydrogen fraction, and/or IGM temperature) persist in the IGM down to z ∼ 5.3, signalling a late end to the reionization process (Bosman et al. 2022). This discrepancy could arise from a number of assumptions in our work that might have a significant bearing on the end of reionization, as now detailed. First, as detailed in Sect. 2.1, we assigned values of fescsf and fescbh based on the dust enrichment of the galaxy and the Eddington fraction, respectively. However, the escape of ionizing radiation is a highly stochastic process that depends on the line of sight (e.g. Paardekooper et al. 2015; Trebitsch et al. 2017) and is strongly modulated over timescales of millions of years due to supernova and radiative feedback (e.g. Rosdahl et al. 2022). Second, we assumed complete suppression of the gas mass for halos in ionized regions below a fixed virial velocity of 50 km s−1. A suppression of the gas content in more (less) massive halos by about 0.5 dex would shift the end stages of reionziation by δz ∼ 0.5, as we have shown in a previous work (Trebitsch et al. 2022). However, this would impact the star formation and AGN growth, which would not significantly impact our results on the relative contributions of these sources to the reionization process. Finally, given the nature of the model, we can only track the volume-filling fractions of neutral/ionized hydrogen rather than the reionization-related fluctuations measured by observations. We aim at fully implementing our semi-analytic model into a hydrodynamic framework to be able to track these fluctuations at the end stages of reionization in future works.
3.4. Key sources of reionization
We now discuss the relative contribution of star-forming galaxies and AGN to the reionization process and account for its feedback (Eq. (5)), as shown in Fig. 4. As noted above, in our fiducial model, the midpoint of reionization occurs at z ∼ 6.9, and reionization is over by z ∼ 5.9. Star formation in low-mass galaxies (with M* ≲ 109 M⊙) is the key driver of the reionization process, providing > 80% of ionizing photons at any redshift between z ∼ 7.1 − 20. As reionization proceeds and the volume-filling fraction exceeds 50% at z ∼ 6.9, the gas masses and star formation rates of these sources are increasingly suppressed by UV feedback. This results in the emissivity from star formation that turns over at z ≲ 7 and drops from providing 75% of ionizing photons at z ∼ 7 to 33% by the end of reionization at z ∼ 5.9. With their lower number densities, star formation in high-mass galaxies (with M* ≳ 109 M⊙) has a negligible contribution (≲5%) at any redshift between z ∼ 6 − 20.
 |
Fig. 4. Redshift evolution of the escape rate of ionizing photons from star-forming galaxies and AGN, weighted over the volume-filling fraction to account for the effects of reionization feedback (Eq. (5)). The dotted line shows the maximum AGN contribution assuming fescbh = 1. We also show the total contribution deconstructed into sources with stellar masses above and below 109 M⊙, as marked. Points show the observational results from Becker & Bolton (2013, empty circles), Becker et al. (2021, filled circles) and Gaikwad et al. (2023, filled triangles). The vertical short-dashed (long-dashed) line shows the redshift at which the IGM is half (fully) ionized, i.e., QII = 0.5 (1), as marked. |
As an increasing number of massive black holes assembles through efficient accretion, the AGN contribution to reionization increases with cosmic time from about 26% at z ∼ 7 to 66% by z ∼ 5.9. This contribution is originally driven by putative black holes in low-mass sources (M* ≲ 109 M⊙) at z ≳ 7.3. However, as a result of their higher accretion rates (and hence, production rate of ionizing photons) and the UV-suppression of low-mass systems, black holes in high-mass galaxies (M* ≳ 109 M⊙) start to dominate the AGN contribution to reionization at z ≲ 7.3 and make up ∼70% of the total AGN budget by z ∼ 6. However, despite their high numbers, high accretion rates, and higher escape fractions (as compared to star formation), AGN only contribute as much as star-forming galaxies in terms of the ionizing budget by z ∼ 6.2, when reionization is already 80% complete and therefore in its end stages.
Finally, we show a maximum AGN contribution case, for which we assumed fescbh = 1. In this case, AGN can overtake the contribution from galaxies as early as z ∼ 7.5. However, as pointed out in our previous works (e.g. Dayal et al. 2020), we reiterate that this case can be ruled out because it exceeds the emissivity values observed at z ≲ 6 (by e.g. Becker & Bolton 2013; Becker et al. 2021; Gaikwad et al. 2023).
In terms of the cumulative photon budget in the fiducial model, the qualitative picture is very similar. Dominating the photon contribution for most of the reionization history, star formation in low-mass galaxies (M* ≲ 109 M⊙) provides more than two-thirds (∼77%) of the cumulative photon budget; star formation in higher-mass halos play a negligible role, providing < 3% of the total reionization photon budget. As a result of their rising number densities at z ≲ 7, AGN provide one-fourth (about 23%) of the reionization budget. This is mostly driven by AGN in high-mass halos (M* ≳ 109 M⊙), which make up about 16.5% of the budget, with AGN in lower-mass halos providing the final ∼6.5% of reionization photons. Our result that star formation in low-mass galaxies is the key reionization driver (e.g. Robertson et al. 2015; Atek et al. 2024), with AGN playing a role only toward the very end stages, agrees excellently with previous works (e.g. Chardin et al. 2017; Onoue et al. 2017; Dayal et al. 2020; Trebitsch et al. 2023).
Finally, we studied an extreme model in which AGN are assumed to be completely dust-free at z ≳ 7 and converge to the fiducial model at lower redshifts. This is driven by the tentatively high amplitude of the AGN UV LF inferred at z ∼ 10, which agrees with a dust-free AGN scenario, as shown in Sect. 3.1. Even in this case, the relative contribution of AGN and star-forming galaxies remains unchanged.
3.5. Impact of the escape fraction of ionizing photons from AGN
In order to study the impact of fescbh on our results, we studied a contrasting model in which we assumed that the unobscured fraction of AGN is a proxy for fescbh (see Dayal et al. 2020, for details and extensive comparison of different approaches on fescbh). We used the results from Merloni et al. (2014), who reported that fescbh scales with the intrinsic X-ray luminosity in the 2–10 keV range in a redshift-independent manner, such that
 (6)
(6)
This model results in a scenario in which fescbh ∝ M*, such that fescbh increases from 10% to 95% as M* increases from 109.5 to 1011 M⊙. This is in contrast to the fiducial model, where fescbh ∝ M*−1 and has a value of fescbh ∼ 40% (5%) for M* ∼ 109.5 (1011) M⊙.
We show the cumulative AGN contribution to reionization for both of these fescbh models in Fig. 5. Qualitatively, our results remain unchanged in that even in the Merloni fescbh scenario, AGN contribute less than one-third (∼30%) of the photons to reionization by the end of the process at zreio ∼ 6.5; this is slightly more than the 22% of the photons provided by AGN in the fiducial model by zreio = 5.9. A key difference between these models is that because fescbh increases with M*, in the Merloni model, black holes in high-mass galaxies (M* ≳ 109 M⊙) always make up the dominant AGN contribution. This model also shows a steeper slope of the AGN contribution to reionization with decreasing redshift as increasingly massive black holes assemble and start to contribute to reionization through a higher escape output of ionizing photons.
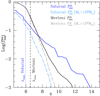 |
Fig. 5. Cumulative fraction of ionizing photons contributed by AGN as a function of redshift ( |

4. Conclusions and discussion
With its sensitivity in the rest-frame optical, the JWST has yielded an unprecedented sample of black holes in the first billion years, comprising both intrinsically faint and reddened sources. Together, these objects could contribute as much as 15% to the observed (i.e., dust-attenuated) UV LF at intermediate luminosities (MUV ∼ −18 to −21) at z ∼ 5. We used the DELPHI semi-analytic model (Dayal et al. 2019), tuned to the latest galaxy and AGN observables at z ∼ 5 − 9, to revisit the black hole contribution to reionization in light of these results. We included heavy seeding mechanisms and allowed high accretion rates to reproduce the observables for AGN at z ∼ 5 − 7. In addition to a detailed model for the dust enrichment of early galaxies (introduced in Dayal et al. 2020), we included a phenomenological model for the dust attenuation of black holes. Finally, we used low-redshift analogs of Lyman-continuum emitters to link the escape fraction of ionizing photons from star formation (fescsf) to the dust-attenuated UV magnitude. We assumed the escape fraction of ionizing photons from black holes (fescbh) to be the same as the escape fraction of UV photons in the fiducial model. With this model, which matches the key reionization constraints (the electron-scattering optical depth and the emissivity) and includes roughly 0.5 dex of scatter on all free parameters, our key findings are listed below.
-
While star-forming galaxies dominate the faint-to-intermediate end of the UV LF (MUV ≳ −21), AGN determine the behavior at the bright end at z ∼ 5. However, the importance of AGN decreases with increasing redshift, such that they are subdominant at all magnitudes by z ∼ 10.
-
The intrinsic production rate of ionizing photons from star formation scales roughly linearly with M* as
 , where δ = (45.9, 46.6) at z ∼ (5, 10). The production rate of ionizing photons from AGN depends on mass and redshift: While AGN dominate star formation for M* ∼ 109.2 − 11.4 M⊙ galaxies at z ∼ 5, their contribution becomes subdominant at all stellar masses by z ∼ 10.
 -
The value of fescsf decreases with M* as galaxies become more dust enriched. For example, at z ∼ 5, fescsf drops from about 16% to < 1% as M* increases from 107 to 1012 M⊙. On the other hand, fescbh > 80% for M* ≲ 108.5 M⊙ and shows a steep drop with increasing masses at all z ∼ 5 − 10.
-
In the fiducial model, reionization reaches its midpoint at z ∼ 6.9 and is over by z ∼ 5.9. Low-mass (M* ≲ 109 M⊙) star-forming galaxies are the key drivers of the reionization process, providing > 80% of ionizing photons at any redshift between z ∼ 7.1 − 20. Higher-mass galaxies provide less than 5% of ionizing photons at any redshift.
-
As an increasing number of black holes start to accrete efficiently with decreasing redshift, the AGN contribution rises from about 26% at the midpoint of reionization (z ∼ 7) to dominating the instantaneous budget (∼66%) by the end-stages at z ∼ 5.9. This is mostly driven by AGN in high-mass halos (M* ≳ 109 M⊙).
-
Despite their high numbers, high accretion rates, and higher escape fractions, AGN only contribute as much as star-forming galaxies in terms of the ionizing budget by z ∼ 6.2 when reionization is already in its end stages.
-
Overall, low-mass star-forming galaxies (M* ≲ 109 M⊙) provide ∼77% of the cumulative photon budget; star formation in higher-mass halos play a negligible role and provides < 3% of the total reionization photon budget. AGN provide about 23% of the total reionization budget, which is mostly driven by AGN in high-mass halos (M* ≲ 109 M⊙), with AGN in low-mass halos providing the final ∼6.5% of reionization photons.
-
A model with fescbh = 1 can be ruled out because it severely exceeds the observed emissivity constraints at z ≲ 6.
-
Finally, we found that, provided fescbh < 1, even contrasting models of fescbh where fescbh ∝ M* or fescbh ∝ M*−1 do not affect our results significantly, with AGN providing less than one-third of the total photon budget needed for reionization.
Our result that low-mass galaxies dominate the reionization process, with AGN affecting it in its end-stages, agree well with a number of previous works (Robertson et al. 2015; Atek et al. 2024; Chardin et al. 2017; Onoue et al. 2017; Dayal et al. 2020; Trebitsch et al. 2023). A key caveat, however, persists with regard to the exact nature and number densities of faint AGN. The origin of the UV emission is unclear in the case of the LRDs, and in Fig. 1, their observed UV luminosity is attributed solely to black hole accretion. However, for faint AGN, the UV luminosity could trace both the star-forming and AGN components (Maiolino; private communication). Detailed spectroscopic analyses will be crucial in shedding light on the nature and numbers of these objects. Additionally, combining the results from multiple surveys will be crucial in obtaining a handle on the cosmic variance associated with their number densities. We also caution that we have used an extremely simple geometrical model for the escape fraction model we used for star-forming galaxies and AGN. While we assumed spherical symmetry, the complex ISM might have a number of sight lines that could allow a lower or higher escape fraction of UV photons and ionizing radiation. This line-of-sight escape remains a key outstanding issue, solving which would benefit tremendously from spectroscopy of such objects.
Over the next decade, we plan to cross-correlate spectroscopically confirmed galaxies and AGN and tomographic 21 cm data from (e.g.,) the SKA. These will be crucial to shed light on the progress and key sources of reionization through the distribution and redshift evolution of ionized bubble sizes and their clustering (e.g. Hutter et al. 2019).
Acknowledgments
PD acknowledge support from the NWO grant 016.VIDI.189.162 (“ODIN”) and warmly thanks the European Commission’s and University of Groningen’s CO-FUND Rosalind Franklin program. J.E.G. acknowledges support from NSF/AAG grant 1007094, and also support from NSF/AAG grant 1007052. VK acknowledges funding from the Dutch Research Council (NWO) through the award of the Vici Grant VI.C.212.036. The research of CCW is supported by NOIRLab, which is managed by the Association of Universities for Research in Astronomy (AURA) under a cooperative agreement with the National Science Foundation. AZ acknowledges support by Grant No. 2020750 from the United States-Israel Binational Science Foundation (BSF) and Grant No. 2109066 from the United States National Science Foundation (NSF); by the Ministry of Science & Technology, Israel; and by the Israel Science Foundation Grant No. 864/23. HA and IC acknowledge support from CNES, focused on the JWST mission, and the Programme National Cosmology and Galaxies (PNCG) of CNRS/INSU with INP and IN2P3, co-funded by CEA and CNES. KG and TN acknowledge support from Australian Research Council Laureate Fellowship FL180100060. This work has received funding from the Swiss State Secretariat for Education, Research and Innovation (SERI) under contract number MB22.00072, as well as from the Swiss National Science Foundation (SNSF) through project grant 200020_207349. The Cosmic Dawn Center (DAWN) is funded by the Danish National Research Foundation under grant DNRF140.
References
- Akiyama, M., He, W., Ikeda, H., et al. 2018, PASJ, 70, S34 [NASA ADS] [CrossRef] [Google Scholar]
- Alexander, T., & Natarajan, P. 2014, Science, 345, 1330 [NASA ADS] [CrossRef] [Google Scholar]
- Amaro-Seoane, P., Andrews, J., Arca Sedda, M., et al. 2023, Liv. Rev. Relat., 26, 2 [NASA ADS] [CrossRef] [Google Scholar]
- Atek, H., Labbé, I., Furtak, L. J., et al. 2024, Nature, 626, 975 [NASA ADS] [CrossRef] [Google Scholar]
- Becker, G. D., & Bolton, J. S. 2013, MNRAS, 436, 1023 [Google Scholar]
- Becker, G. D., D’Aloisio, A., Christenson, H. M., et al. 2021, MNRAS, 508, 1853 [NASA ADS] [CrossRef] [Google Scholar]
- Belczynski, K., Kalogera, V., & Bulik, T. 2002, ApJ, 572, 407 [NASA ADS] [CrossRef] [Google Scholar]
- Béthermin, M., Fudamoto, Y., Ginolfi, M., et al. 2020, A&A, 643, A2 [Google Scholar]
- Bogdán, Á., Goulding, A. D., Natarajan, P., et al. 2024, Nat. Astron., 8, 126 [Google Scholar]
- Bosman, S. E. I., Davies, F. B., Becker, G. D., et al. 2022, MNRAS, 514, 55 [NASA ADS] [CrossRef] [Google Scholar]
- Boutsia, K., Grazian, A., Giallongo, E., Fiore, F., & Civano, F. 2018, ApJ, 869, 20 [NASA ADS] [CrossRef] [Google Scholar]
- Bouwens, R. J., Illingworth, G. D., Oesch, P. A., et al. 2014, ApJ, 793, 115 [Google Scholar]
- Bouwens, R. J., Oesch, P. A., Stefanon, M., et al. 2021, AJ, 162, 47 [NASA ADS] [CrossRef] [Google Scholar]
- Bouwens, R. J., Smit, R., Schouws, S., et al. 2022, ApJ, 931, 160 [NASA ADS] [CrossRef] [Google Scholar]
- Bower, R. G., Schaye, J., Frenk, C. S., et al. 2017, MNRAS, 465, 32 [NASA ADS] [CrossRef] [Google Scholar]
- Bowler, R. A. A., Jarvis, M. J., Dunlop, J. S., et al. 2020, MNRAS, 493, 2059 [Google Scholar]
- Chardin, J., Puchwein, E., & Haehnelt, M. G. 2017, MNRAS, 465, 3429 [NASA ADS] [CrossRef] [Google Scholar]
- Chisholm, J., Saldana-Lopez, A., Flury, S., et al. 2022, MNRAS, 517, 5104 [CrossRef] [Google Scholar]
- Choudhury, T. R., & Dayal, P. 2019, MNRAS, 482, L19 [Google Scholar]
- Circosta, C., Vignali, C., Gilli, R., et al. 2019, A&A, 623, A172 [NASA ADS] [CrossRef] [EDP Sciences] [Google Scholar]
- Davies, F. B., Hennawi, J. F., Bañados, E., et al. 2018, ApJ, 864, 142 [NASA ADS] [CrossRef] [Google Scholar]
- Dayal, P., & Ferrara, A. 2018, Phys. Rep., 780, 1 [Google Scholar]
- Dayal, P., Rossi, E. M., Shiralilou, B., et al. 2019, MNRAS, 486, 2336 [Google Scholar]
- Dayal, P., Volonteri, M., Choudhury, T. R., et al. 2020, MNRAS, 495, 3065 [Google Scholar]
- Dayal, P., Ferrara, A., Sommovigo, L., et al. 2022, MNRAS, 512, 989 [NASA ADS] [CrossRef] [Google Scholar]
- Devecchi, B., & Volonteri, M. 2009, ApJ, 694, 302 [NASA ADS] [CrossRef] [Google Scholar]
- Donnan, C. T., McLeod, D. J., Dunlop, J. S., et al. 2023, MNRAS, 518, 6011 [Google Scholar]
- Fan, X., Carilli, C. L., & Keating, B. 2006, ARA&A, 44, 415 [Google Scholar]
- Finkelstein, S. L., Ryan, R. E., Jr, Papovich, C., et al. 2015, ApJ, 810, 71 [NASA ADS] [CrossRef] [Google Scholar]
- Flury, S. R., Jaskot, A. E., Ferguson, H. C., et al. 2022, ApJS, 260, 1 [NASA ADS] [CrossRef] [Google Scholar]
- Fontanot, F., Cristiani, S., Grazian, A., et al. 2023, MNRAS, 520, 740 [Google Scholar]
- Fujimoto, S., Brammer, G. B., Watson, D., et al. 2022, Nature, 604, 261 [NASA ADS] [CrossRef] [Google Scholar]
- Fujimoto, S., Wang, B., Weaver, J. R., et al. 2024, ApJ, 977, 250 [NASA ADS] [CrossRef] [Google Scholar]
- Furtak, L. J., Zitrin, A., Plat, A., et al. 2023, ApJ, 952, 142 [NASA ADS] [CrossRef] [Google Scholar]
- Furtak, L. J., Labbé, I., Zitrin, A., et al. 2024, Nature, 628, 57 [NASA ADS] [CrossRef] [Google Scholar]
- Gaikwad, P., Haehnelt, M. G., Davies, F. B., et al. 2023, MNRAS, 525, 4093 [NASA ADS] [CrossRef] [Google Scholar]
- Giallongo, E., Grazian, A., Fiore, F., et al. 2015, A&A, 578, A83 [NASA ADS] [CrossRef] [EDP Sciences] [Google Scholar]
- Giallongo, E., Grazian, A., Fiore, F., et al. 2019, ApJ, 884, 19 [Google Scholar]
- Gnedin, N. Y. 2000, ApJ, 542, 535 [Google Scholar]
- Gnedin, N. Y., Kravtsov, A. V., & Chen, H.-W. 2008, ApJ, 672, 765 [Google Scholar]
- Goulding, A. D., Greene, J. E., Setton, D. J., et al. 2023, ApJ, 955, L24 [NASA ADS] [CrossRef] [Google Scholar]
- Grazian, A., Giallongo, E., Boutsia, K., et al. 2018, A&A, 613, A44 [NASA ADS] [CrossRef] [EDP Sciences] [Google Scholar]
- Greene, J. E., Labbe, I., Goulding, A. D., et al. 2024, ApJ, 964, 39 [CrossRef] [Google Scholar]
- Harikane, Y., Ono, Y., Ouchi, M., et al. 2022, ApJS, 259, 20 [NASA ADS] [CrossRef] [Google Scholar]
- Harikane, Y., Ouchi, M., Oguri, M., et al. 2023a, ApJS, 265, 5 [NASA ADS] [CrossRef] [Google Scholar]
- Harikane, Y., Zhang, Y., Nakajima, K., et al. 2023b, ApJ, 959, 39 [NASA ADS] [CrossRef] [Google Scholar]
- Harikane, Y., Nakajima, K., Ouchi, M., et al. 2024, ApJ, 960, 56 [NASA ADS] [CrossRef] [Google Scholar]
- Hutter, A., Dayal, P., Malhotra, S., et al. 2019, BAAS, 51, 57 [NASA ADS] [Google Scholar]
- Hutter, A., Dayal, P., Yepes, G., et al. 2021, MNRAS, 503, 3698 [NASA ADS] [CrossRef] [Google Scholar]
- Jung, I., Finkelstein, S. L., Dickinson, M., et al. 2020, ApJ, 904, 144 [NASA ADS] [CrossRef] [Google Scholar]
- Kobayashi, C., Karakas, A. I., & Lugaro, M. 2020, ApJ, 900, 179 [Google Scholar]
- Kocevski, D. D., Onoue, M., Inayoshi, K., et al. 2023, ApJ, 954, L4 [NASA ADS] [CrossRef] [Google Scholar]
- Kokorev, V., Fujimoto, S., Labbe, I., et al. 2023, ApJ, 957, L7 [NASA ADS] [CrossRef] [Google Scholar]
- Kokorev, V., Caputi, K. I., Greene, J. E., et al. 2024, ApJ, 968, 38 [NASA ADS] [CrossRef] [Google Scholar]
- Labbé, I., van Dokkum, P., Nelson, E., et al. 2023, Nature, 616, 266 [CrossRef] [Google Scholar]
- Labbe, I., Greene, J. E., Bezanson, R., et al. 2025, ApJ, 978, 92 [NASA ADS] [CrossRef] [Google Scholar]
- Larson, R. L., Finkelstein, S. L., Kocevski, D. D., et al. 2023, ApJ, 953, L29 [NASA ADS] [CrossRef] [Google Scholar]
- Leigh, N. W. C., Böker, T., Maccarone, T. J., & Perets, H. B. 2013, MNRAS, 429, 2997 [Google Scholar]
- Leitherer, C., Schaerer, D., Goldader, J. D., et al. 1999, ApJS, 123, 3 [Google Scholar]
- Lu, T.-Y., Goto, T., Tang, J.-J., et al. 2020, ApJ, 893, 69 [Google Scholar]
- Madau, P. 2017, ApJ, 851, 50 [NASA ADS] [CrossRef] [Google Scholar]
- Madau, P., Haardt, F., & Rees, M. J. 1999, ApJ, 514, 648 [CrossRef] [Google Scholar]
- Maiolino, R., Scholtz, J., Curtis-Lake, E., et al. 2024a, A&A, 691, A145 [NASA ADS] [CrossRef] [EDP Sciences] [Google Scholar]
- Maiolino, R., Scholtz, J., Witstok, J., et al. 2024b, Nature, 627, 59 [NASA ADS] [CrossRef] [Google Scholar]
- Matthee, J., Naidu, R. P., Brammer, G., et al. 2024, ApJ, 963, 129 [NASA ADS] [CrossRef] [Google Scholar]
- Mauerhofer, V., & Dayal, P. 2023, MNRAS, 526, 2196 [NASA ADS] [CrossRef] [Google Scholar]
- McGreer, I. D., Fan, X., Jiang, L., & Cai, Z. 2018, AJ, 155, 131 [NASA ADS] [CrossRef] [Google Scholar]
- McLeod, D. J., Donnan, C. T., McLure, R. J., et al. 2024, MNRAS, 527, 5004 [Google Scholar]
- Merloni, A., Bongiorno, A., Brusa, M., et al. 2014, MNRAS, 437, 3550 [Google Scholar]
- Mitra, S., Choudhury, T. R., & Ferrara, A. 2018, MNRAS, 473, 1416 [Google Scholar]
- Nakane, M., Ouchi, M., Nakajima, K., et al. 2024, ApJ, 967, 28 [NASA ADS] [CrossRef] [Google Scholar]
- Natarajan, P., Pacucci, F., Ricarte, A., et al. 2024, ApJ, 960, L1 [NASA ADS] [CrossRef] [Google Scholar]
- Niida, M., Nagao, T., Ikeda, H., et al. 2020, ApJ, 904, 89 [NASA ADS] [CrossRef] [Google Scholar]
- Oesch, P. A., Bouwens, R. J., Illingworth, G. D., Labbé, I., & Stefanon, M. 2018, ApJ, 855, 105 [Google Scholar]
- Oke, J. B., & Gunn, J. E. 1983, ApJ, 266, 713 [NASA ADS] [CrossRef] [Google Scholar]
- Ono, Y., Ouchi, M., Harikane, Y., et al. 2018, PASJ, 70, S10 [Google Scholar]
- Onoue, M., Kashikawa, N., Willott, C. J., et al. 2017, ApJ, 847, L15 [NASA ADS] [CrossRef] [Google Scholar]
- Paardekooper, J.-P., Khochfar, S., & Dalla Vecchia, C. 2015, MNRAS, 451, 2544 [Google Scholar]
- Parsa, S., Dunlop, J. S., & McLure, R. J. 2018, MNRAS, 474, 2904 [Google Scholar]
- Pawlik, A. H., Schaye, J., & van Scherpenzeel, E. 2009, MNRAS, 394, 1812 [Google Scholar]
- Piana, O., Dayal, P., & Choudhury, T. R. 2022, MNRAS, 510, 5661 [NASA ADS] [CrossRef] [Google Scholar]
- Planck Collaboration VI. 2020, A&A, 641, A6 [NASA ADS] [CrossRef] [EDP Sciences] [Google Scholar]
- Rinaldi, P., Caputi, K. I., Iani, E., et al. 2024, ApJ, 969, 12 [NASA ADS] [CrossRef] [Google Scholar]
- Robertson, B. E. 2022, ARA&A, 60, 121 [NASA ADS] [CrossRef] [Google Scholar]
- Robertson, B. E., Ellis, R. S., Furlanetto, S. R., & Dunlop, J. S. 2015, ApJ, 802, L19 [Google Scholar]
- Rosdahl, J., Blaizot, J., Katz, H., et al. 2022, MNRAS, 515, 2386 [CrossRef] [Google Scholar]
- Salpeter, E. E. 1955, ApJ, 121, 161 [Google Scholar]
- Shapiro, P. R., & Giroux, M. L. 1987, ApJ, 321, L107 [NASA ADS] [CrossRef] [Google Scholar]
- Sobacchi, E., & Mesinger, A. 2013, MNRAS, 432, 3340 [CrossRef] [Google Scholar]
- Trebitsch, M., Blaizot, J., Rosdahl, J., Devriendt, J., & Slyz, A. 2017, MNRAS, 470, 224 [Google Scholar]
- Trebitsch, M., Volonteri, M., & Dubois, Y. 2019, MNRAS, 487, 819 [CrossRef] [Google Scholar]
- Trebitsch, M., Dayal, P., Chisholm, J., et al. 2022, A&A, submitted [arXiv:2212.06177] [Google Scholar]
- Trebitsch, M., Hutter, A., Dayal, P., et al. 2023, MNRAS, 518, 3576 [Google Scholar]
- Übler, H., Maiolino, R., Curtis-Lake, E., et al. 2023, A&A, 677, A145 [NASA ADS] [CrossRef] [EDP Sciences] [Google Scholar]
- Ueda, Y., Akiyama, M., Hasinger, G., Miyaji, T., & Watson, M. G. 2014, ApJ, 786, 104 [Google Scholar]
- Yang, J., Wang, F., Fan, X., et al. 2020a, ApJ, 897, L14 [Google Scholar]
- Yang, J., Wang, F., Fan, X., et al. 2020b, ApJ, 904, 26 [Google Scholar]
All Tables
All Figures
|
Fig. 1. Rest-frame UV LF at z ∼ 5, 7, and 10, as marked. In each panel, the long-dashed, dot-dashed, and solid lines show the dust-obscured UV LF for AGN, star formation, and the total luminosity, as marked; the dotted cyan lines show the intrinsic (i.e., not dust-attenuated) AGN UV LF. In all panels, points show observational results as marked: at z ∼ 5 (panel a), for star-forming galaxies (solid circles, Finkelstein et al. 2015; Bouwens et al. 2021), galaxies+AGN (empty circles, Harikane et al. 2022), AGN (empty stars and crosses, Giallongo et al. 2015; Parsa et al. 2018; Niida et al. 2020), and the new JWST AGN results from Matthee et al. (2024, filled hexagons), Maiolino et al. (2024b, empty squares), Harikane et al. (2024, filled triangles), (empty triangles; Scholtz et al. in prep.), Greene et al. (2024, filled squares) and Kokorev et al. (2024, empty hexagons). At z ∼ 7 (panel b), we show the results for star-forming galaxies (solid circles, Bowler et al. 2020; Bouwens et al. 2021), galaxies+AGN (empty circles, Harikane et al. 2022), and the new JWST AGN results from Greene et al. (2024, filled squares) and Kokorev et al. (2024, empty hexagons). At z ∼ 10 (panel c), we show the UV LF inferred for star-forming galaxies (solid circles, Oesch et al. 2018; Bouwens et al. 2021; Donnan et al. 2023; Harikane et al. 2023a; McLeod et al. 2024). At this redshift, the empty hexagons show AGN candidates (UHZ1 and GN-z11), with the number densities calculated as detailed in Fujimoto et al. (2024). |
| In the text | |
|
Fig. 2. Intrinsic production rate of ionizing photons as a function of the stellar mass (left panel) and their escape fractions (right panel) at z ∼ 5 − 10, as marked. In each panel, the solid and dashed lines show the results for star formation and black holes, respectively. |
| In the text | |
|
Fig. 3. Redshift evolution of the electron scattering optical depth (left panel) and the volume-filling fraction of ionizied hydrogen (right panel). We show the volume-filling fraction weighted values from star-forming galaxies and AGN as well as the contribution deconstructed into galaxies with stellar masses above and below 109 M⊙, as marked. In the left panel, the dot-dashed horizontal line and the shaded region show the electron-scattering optical depth and its associated error bars from Planck Collaboration VI (2020). In the right panel, points show compilations of QII results from a number of works (Fan et al. 2006; Davies et al. 2018; Yang et al. 2020a; Jung et al. 2020; Lu et al. 2020; Bosman et al. 2022; Gaikwad et al. 2023; Nakane et al. 2024). |
| In the text | |
|
Fig. 4. Redshift evolution of the escape rate of ionizing photons from star-forming galaxies and AGN, weighted over the volume-filling fraction to account for the effects of reionization feedback (Eq. (5)). The dotted line shows the maximum AGN contribution assuming fescbh = 1. We also show the total contribution deconstructed into sources with stellar masses above and below 109 M⊙, as marked. Points show the observational results from Becker & Bolton (2013, empty circles), Becker et al. (2021, filled circles) and Gaikwad et al. (2023, filled triangles). The vertical short-dashed (long-dashed) line shows the redshift at which the IGM is half (fully) ionized, i.e., QII = 0.5 (1), as marked. |
| In the text | |
|
Fig. 5. Cumulative fraction of ionizing photons contributed by AGN as a function of redshift ( |
| In the text | |
Current usage metrics show cumulative count of Article Views (full-text article views including HTML views, PDF and ePub downloads, according to the available data) and Abstracts Views on Vision4Press platform.
Data correspond to usage on the plateform after 2015. The current usage metrics is available 48-96 hours after online publication and is updated daily on week days.
Initial download of the metrics may take a while.