Fig. 7.
Download original image
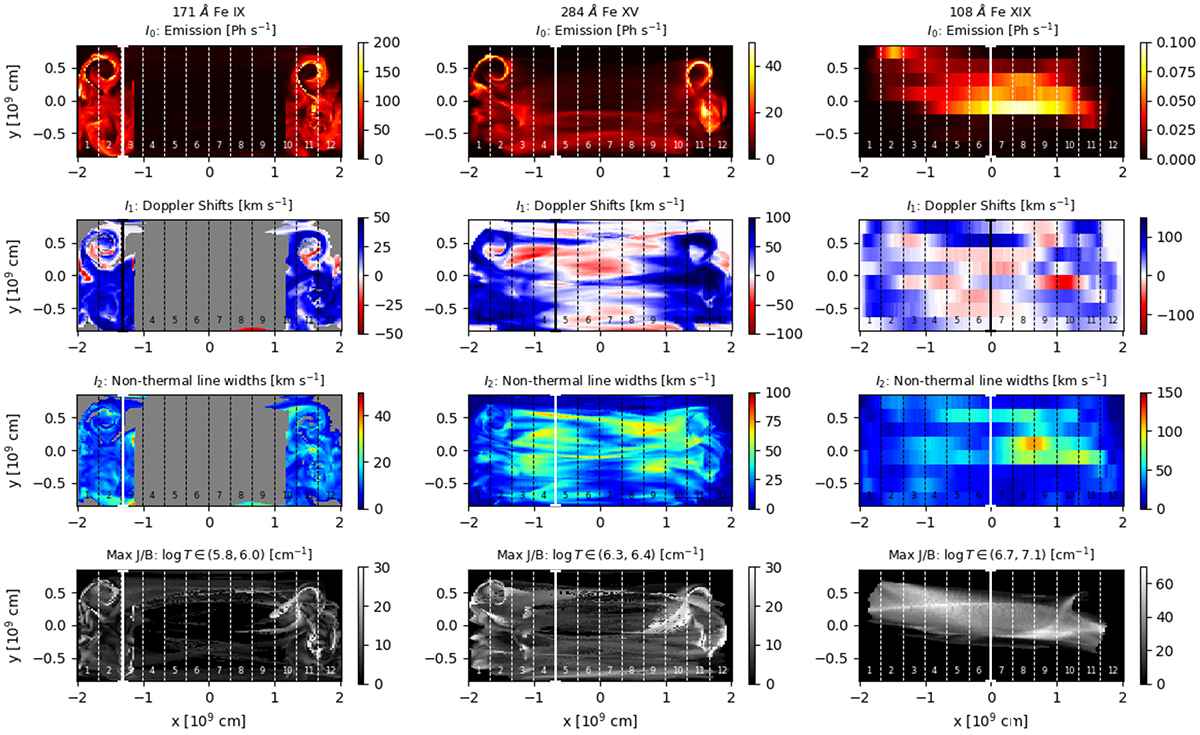
MUSE synthetic maps at time ∼285 s and with the LoS along the ![]() direction (the loop is observed from the top). From the top, the first row shows the intensity of Fe IX, Fe XV, and Fe XIX emission lines. Second row shows the Doppler line shifts. Third row shows the non-thermal line broadenings. In the Fe IX Doppler shifts and widths we show only pixels where the line intensity exceeds the 5% of its peak (
direction (the loop is observed from the top). From the top, the first row shows the intensity of Fe IX, Fe XV, and Fe XIX emission lines. Second row shows the Doppler line shifts. Third row shows the non-thermal line broadenings. In the Fe IX Doppler shifts and widths we show only pixels where the line intensity exceeds the 5% of its peak (![]() ). We show Fe XIX observables rebinned on macropixels (0.4″ × 2.7″). We also show the Fe XIX observables rebinned on macropixels (0.4″ × 2.7″). The fourth shows the maximum of the current density (per each pixel plasma column) in three temperature bins, around the temperature peak of each line. The 12 dashed vertical lines mark the position of the MUSE slits. 12 dashed vertical lines mark the position of the MUSE slits (see online).
). We show Fe XIX observables rebinned on macropixels (0.4″ × 2.7″). We also show the Fe XIX observables rebinned on macropixels (0.4″ × 2.7″). The fourth shows the maximum of the current density (per each pixel plasma column) in three temperature bins, around the temperature peak of each line. The 12 dashed vertical lines mark the position of the MUSE slits. 12 dashed vertical lines mark the position of the MUSE slits (see online).
Current usage metrics show cumulative count of Article Views (full-text article views including HTML views, PDF and ePub downloads, according to the available data) and Abstracts Views on Vision4Press platform.
Data correspond to usage on the plateform after 2015. The current usage metrics is available 48-96 hours after online publication and is updated daily on week days.
Initial download of the metrics may take a while.