Open Access
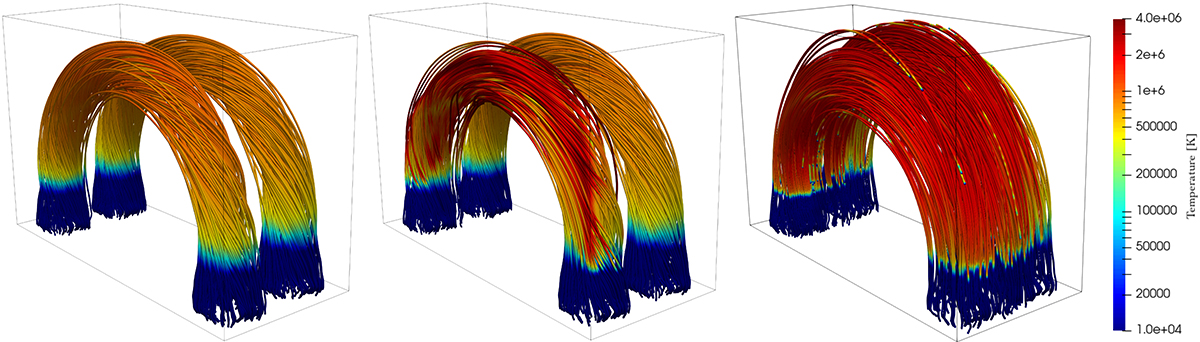
Fig. 4.
Download original image
3D rendering of the magnetic field lines inside the box at the same times shown in Fig. 1. Magnetic field lines are color-coded according to the plasma temperature.
Current usage metrics show cumulative count of Article Views (full-text article views including HTML views, PDF and ePub downloads, according to the available data) and Abstracts Views on Vision4Press platform.
Data correspond to usage on the plateform after 2015. The current usage metrics is available 48-96 hours after online publication and is updated daily on week days.
Initial download of the metrics may take a while.