Open Access
Fig. A.1.
Download original image
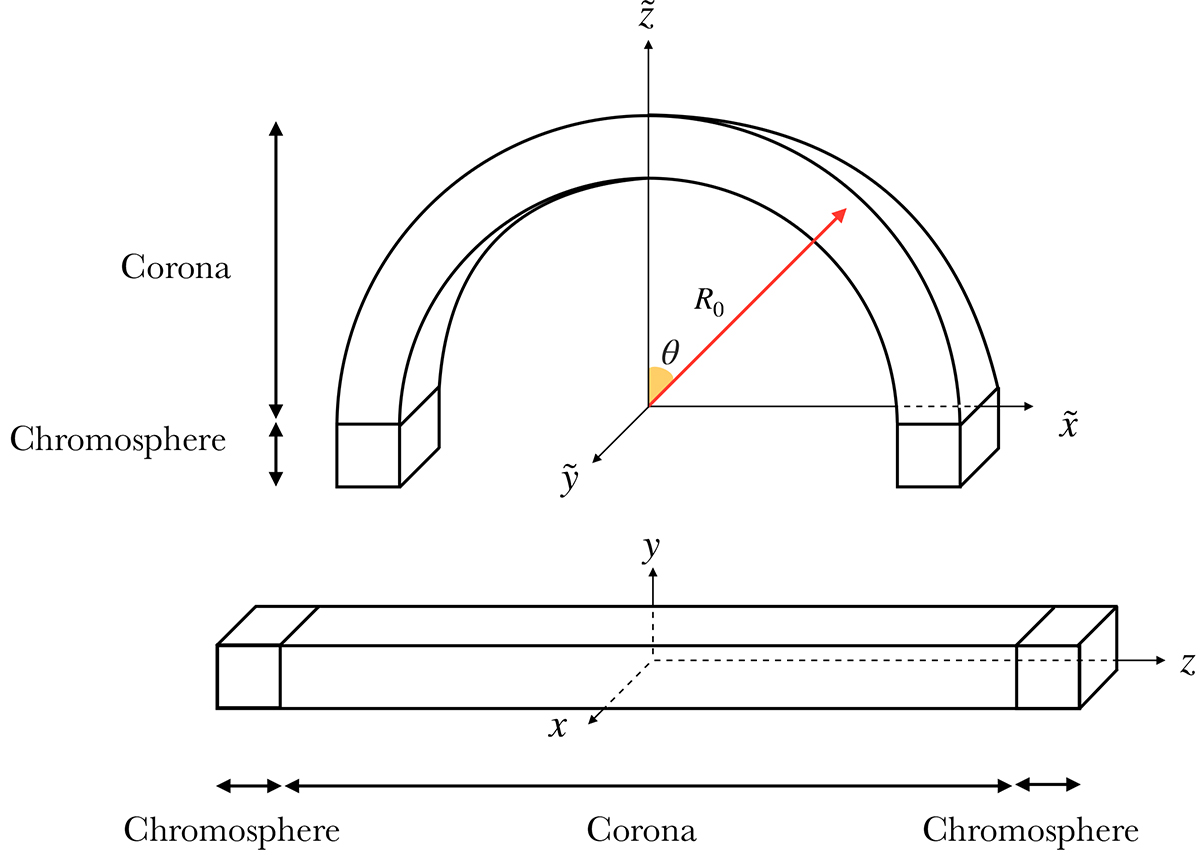
Original and interpolated box geometry. Lower picture: schematic representation of the 3D box containing the computational domain of the simulation. Upper picture: geometry of the interpolated domain mapping the straight flux tube into a curved one.
Current usage metrics show cumulative count of Article Views (full-text article views including HTML views, PDF and ePub downloads, according to the available data) and Abstracts Views on Vision4Press platform.
Data correspond to usage on the plateform after 2015. The current usage metrics is available 48-96 hours after online publication and is updated daily on week days.
Initial download of the metrics may take a while.