Open Access
Fig. 1.
Download original image
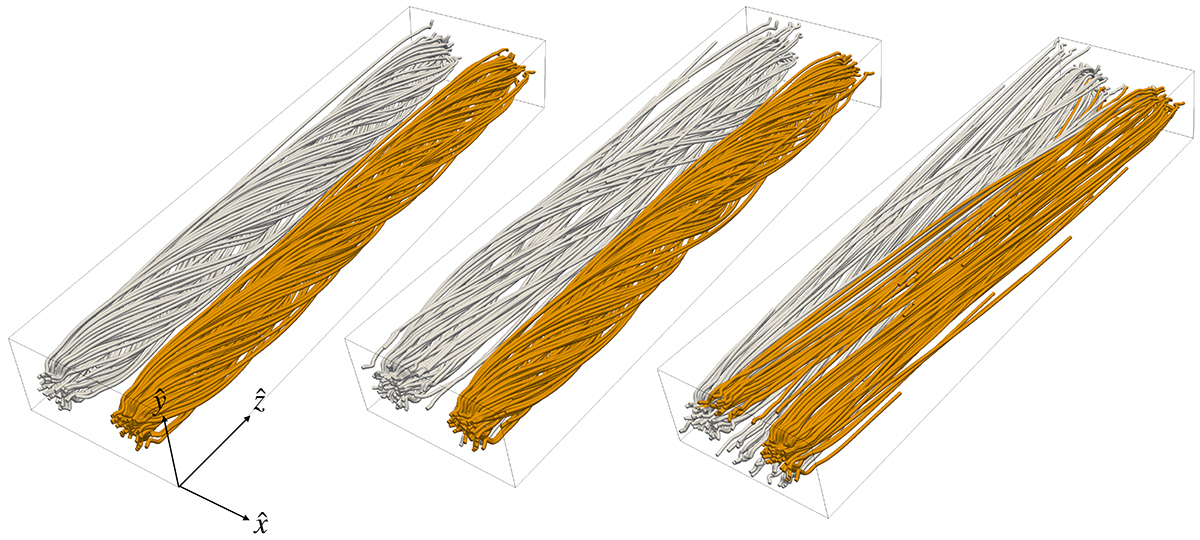
3D rendering of the magnetic field lines inside the box at times (from left to right): t = 0 s (initial condition), 180 s, (first loop disruption), and 500 s. The change in the field line connectivity during the evolution of the MHD cascade is emphasized by the colors.
Current usage metrics show cumulative count of Article Views (full-text article views including HTML views, PDF and ePub downloads, according to the available data) and Abstracts Views on Vision4Press platform.
Data correspond to usage on the plateform after 2015. The current usage metrics is available 48-96 hours after online publication and is updated daily on week days.
Initial download of the metrics may take a while.