Fig. 6.
Download original image
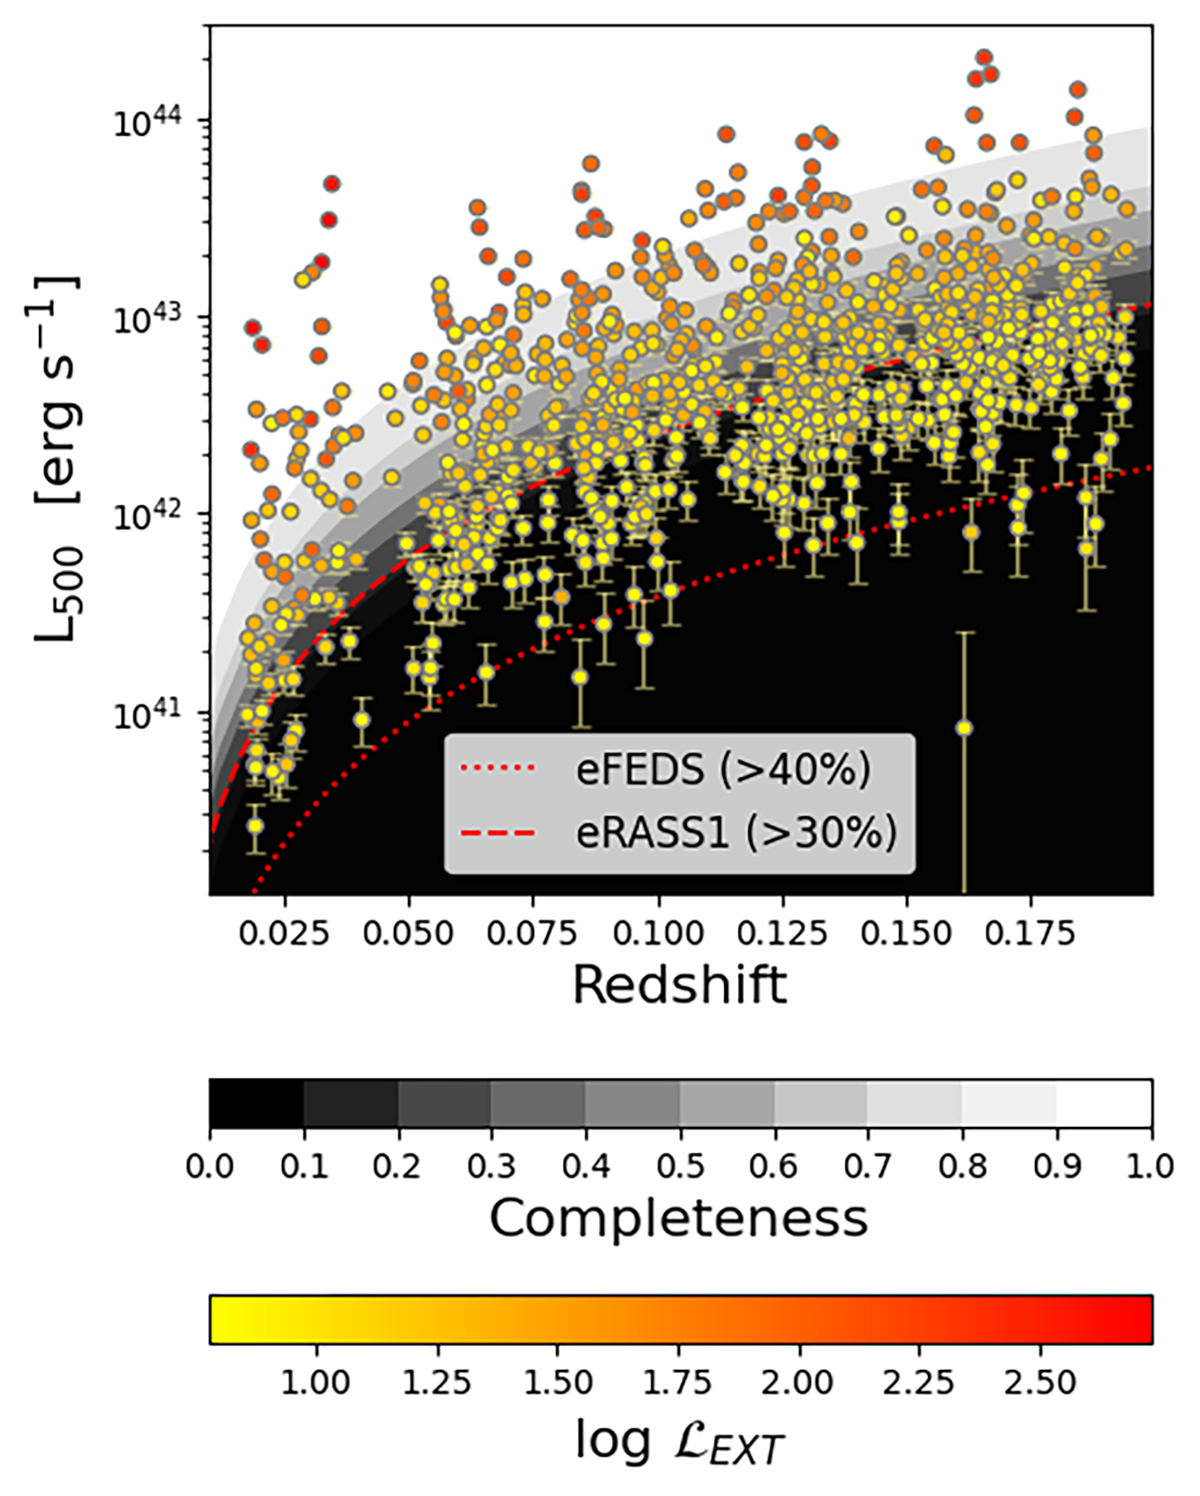
Soft band luminosity distribution of the groups and clusters in the lightcone in function of their redshift. The errors are the 16th and 84th percentile from the MCMC process to extract the luminosity. The data points are colour-coded for their extent likelihood. The shading areas represent the range of survey flux limits given by the completeness from 10% to 90% in steps of 10% difference with decreasing colour. The red curves represent the flux limit in eFEDS (1.5 × 10⁻¹⁴ erg s−1 cm−2; Liu et al. 2022c) and eRASS1 (10−13 erg s−1 cm−2; Seppi et al. 2022) for 40 and 30% completeness respectively.
Current usage metrics show cumulative count of Article Views (full-text article views including HTML views, PDF and ePub downloads, according to the available data) and Abstracts Views on Vision4Press platform.
Data correspond to usage on the plateform after 2015. The current usage metrics is available 48-96 hours after online publication and is updated daily on week days.
Initial download of the metrics may take a while.