| Issue |
A&A
Volume 695, March 2025
|
|
|---|---|---|
| Article Number | C1 | |
| Number of page(s) | 1 | |
| Section | Extragalactic astronomy | |
| DOI | https://doi.org/10.1051/0004-6361/202553853e | |
| Published online | 14 March 2025 | |
Detecting galaxy groups populating the local Universe in the eROSITA era (Corrigendum)
1
European Southern Observatory, Karl-Schwarzschildstr. 2, 85748 Garching bei München, Germany
2
Excellence Cluster ORIGINS, Boltzmannstr. 2, D-85748 Garching bei München, Germany
3
Leibniz-Institut für Astrophysik Potsdam (AIP), An der Sternwarte 16, 14482 Potsdam, Germany
4
Universitäts-Sternwarte, Fakultät für Physik, Ludwig-Maximilians-Universität München, Scheinerstr.1, 81679 München, Germany
5
Max-Planck-Institut für Astrophysik, Karl-Schwarzschildstr. 1, 85741 Garching bei München, Germany
6
INAF – Osservatorio Astronomico di Trieste, Via Tiepolo 11, 34143 Trieste, Italy
7
IFPU – Institute for Fundamental Physics of the Universe, Via Beirut 2, I-34014 Trieste, Italy
8
Max-Planck-Institut für Extraterrestrische Physik (MPE), Giessenbachstr. 1, D-85748 Garching bei München, Germany
9
INAF-Osservatorio Astronomico di Brera, Via E. Bianchi 46, 23807 Merate, (LC), Italy
10
International Centre for Radio Astronomy Research, University of Western Australia, M468, 35 Stirling Highway, Perth, WA 6009, Australia
11
ARC Centre of Excellence for All Sky Astrophysics in 3 Dimensions (ASTRO 3D), Australia
12
Department of Astronomy, University of Geneva, Ch. d’Ecogia 16, CH-1290 Versoix, Switzerland
⋆ Corresponding author; This email address is being protected from spambots. You need JavaScript enabled to view it.
Key words: errata / addenda / methods: data analysis / galaxies: active / galaxies: groups: general / X-rays: galaxies: clusters / X-rays: general
The axes of Fig. 1 were labelled incorrectly in the original paper. We provide the corrected plot here. Additionally, we corrected an error in Lov+15 and Eck+11’s parametric functions for the relation M500 − kT500 which led to a discrepancy (offset of approximately 10–30%) between observed and simulated data.
We note that, at a fixed mass, groups and clusters in Magneticum tend to be somewhat cooler than indicated by the observational scaling relations, which, on the other hand, are in close agreement with each other. Apart from observational uncertainties, which are not plotted here, part of this discrepancy can be mitigated by accounting for the hydrostatic mass bias, as the masses used in observational relations are derived from hydrostatic equilibrium applied to X-ray temperature measurements. Several independent studies of cosmological hydrodynamical simulations consistently indicate that X-ray-derived masses may be biased towards lower values by about 20% (e.g. Biffi et al. 2016; Pratt et al. 2019, and references therein). This bias is partly due to the violation of the hydrostatic equilibrium assumption for a spherical system.
Additionally, the discrepancy may also arise when comparing mass-weighted temperatures with temperatures obtained from fitting X-ray spectra (Mazzotta et al. 2004; Rasia et al. 2014; ZuHone et al. 2023). This bias would result in lower temperatures in the simulations compared to observations.
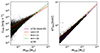 |
Fig. 1. X-ray scaling relations recovered from the halo population in the lightcone, with L500 − M500 in the left panel and kT500 − M500 in the right panel. The luminosity L500 is intended as the IGrM-only emission including Galactic absorption in the 0.1 − 2.4 keV band within R500. For reference, literature values are also reported. The masses and mass-weighted temperature were calculated in the same radius R500. Considering the small redshift range, we neglected any evolutionary changes in the scaling. |
References
- Biffi, V., Borgani, S., Murante, G., et al. 2016, ApJ, 827, 112 [NASA ADS] [CrossRef] [Google Scholar]
- Mazzotta, P., Rasia, E., Moscardini, L., & Tormen, G. 2004, MNRAS, 354, 10 [NASA ADS] [CrossRef] [Google Scholar]
- Pratt, G. W., Arnaud, M., Biviano, A., et al. 2019, SSR, 215, 25 [NASA ADS] [Google Scholar]
- Rasia, E., Lau, E. T., Nagai, D., et al. 2014, ApJ, 791, 96 [NASA ADS] [CrossRef] [Google Scholar]
- ZuHone, J., Bahar, Y. E., Biffi, V., et al. 2023, A&A, 675, A150 [NASA ADS] [CrossRef] [EDP Sciences] [Google Scholar]
© The Authors 2025
 Open Access article, published by EDP Sciences, under the terms of the Creative Commons Attribution License (https://creativecommons.org/licenses/by/4.0), which permits unrestricted use, distribution, and reproduction in any medium, provided the original work is properly cited.
This article is published in open access under the Subscribe to Open model. This email address is being protected from spambots. You need JavaScript enabled to view it. to support open access publication.
All Figures
|
Fig. 1. X-ray scaling relations recovered from the halo population in the lightcone, with L500 − M500 in the left panel and kT500 − M500 in the right panel. The luminosity L500 is intended as the IGrM-only emission including Galactic absorption in the 0.1 − 2.4 keV band within R500. For reference, literature values are also reported. The masses and mass-weighted temperature were calculated in the same radius R500. Considering the small redshift range, we neglected any evolutionary changes in the scaling. |
| In the text | |
Current usage metrics show cumulative count of Article Views (full-text article views including HTML views, PDF and ePub downloads, according to the available data) and Abstracts Views on Vision4Press platform.
Data correspond to usage on the plateform after 2015. The current usage metrics is available 48-96 hours after online publication and is updated daily on week days.
Initial download of the metrics may take a while.