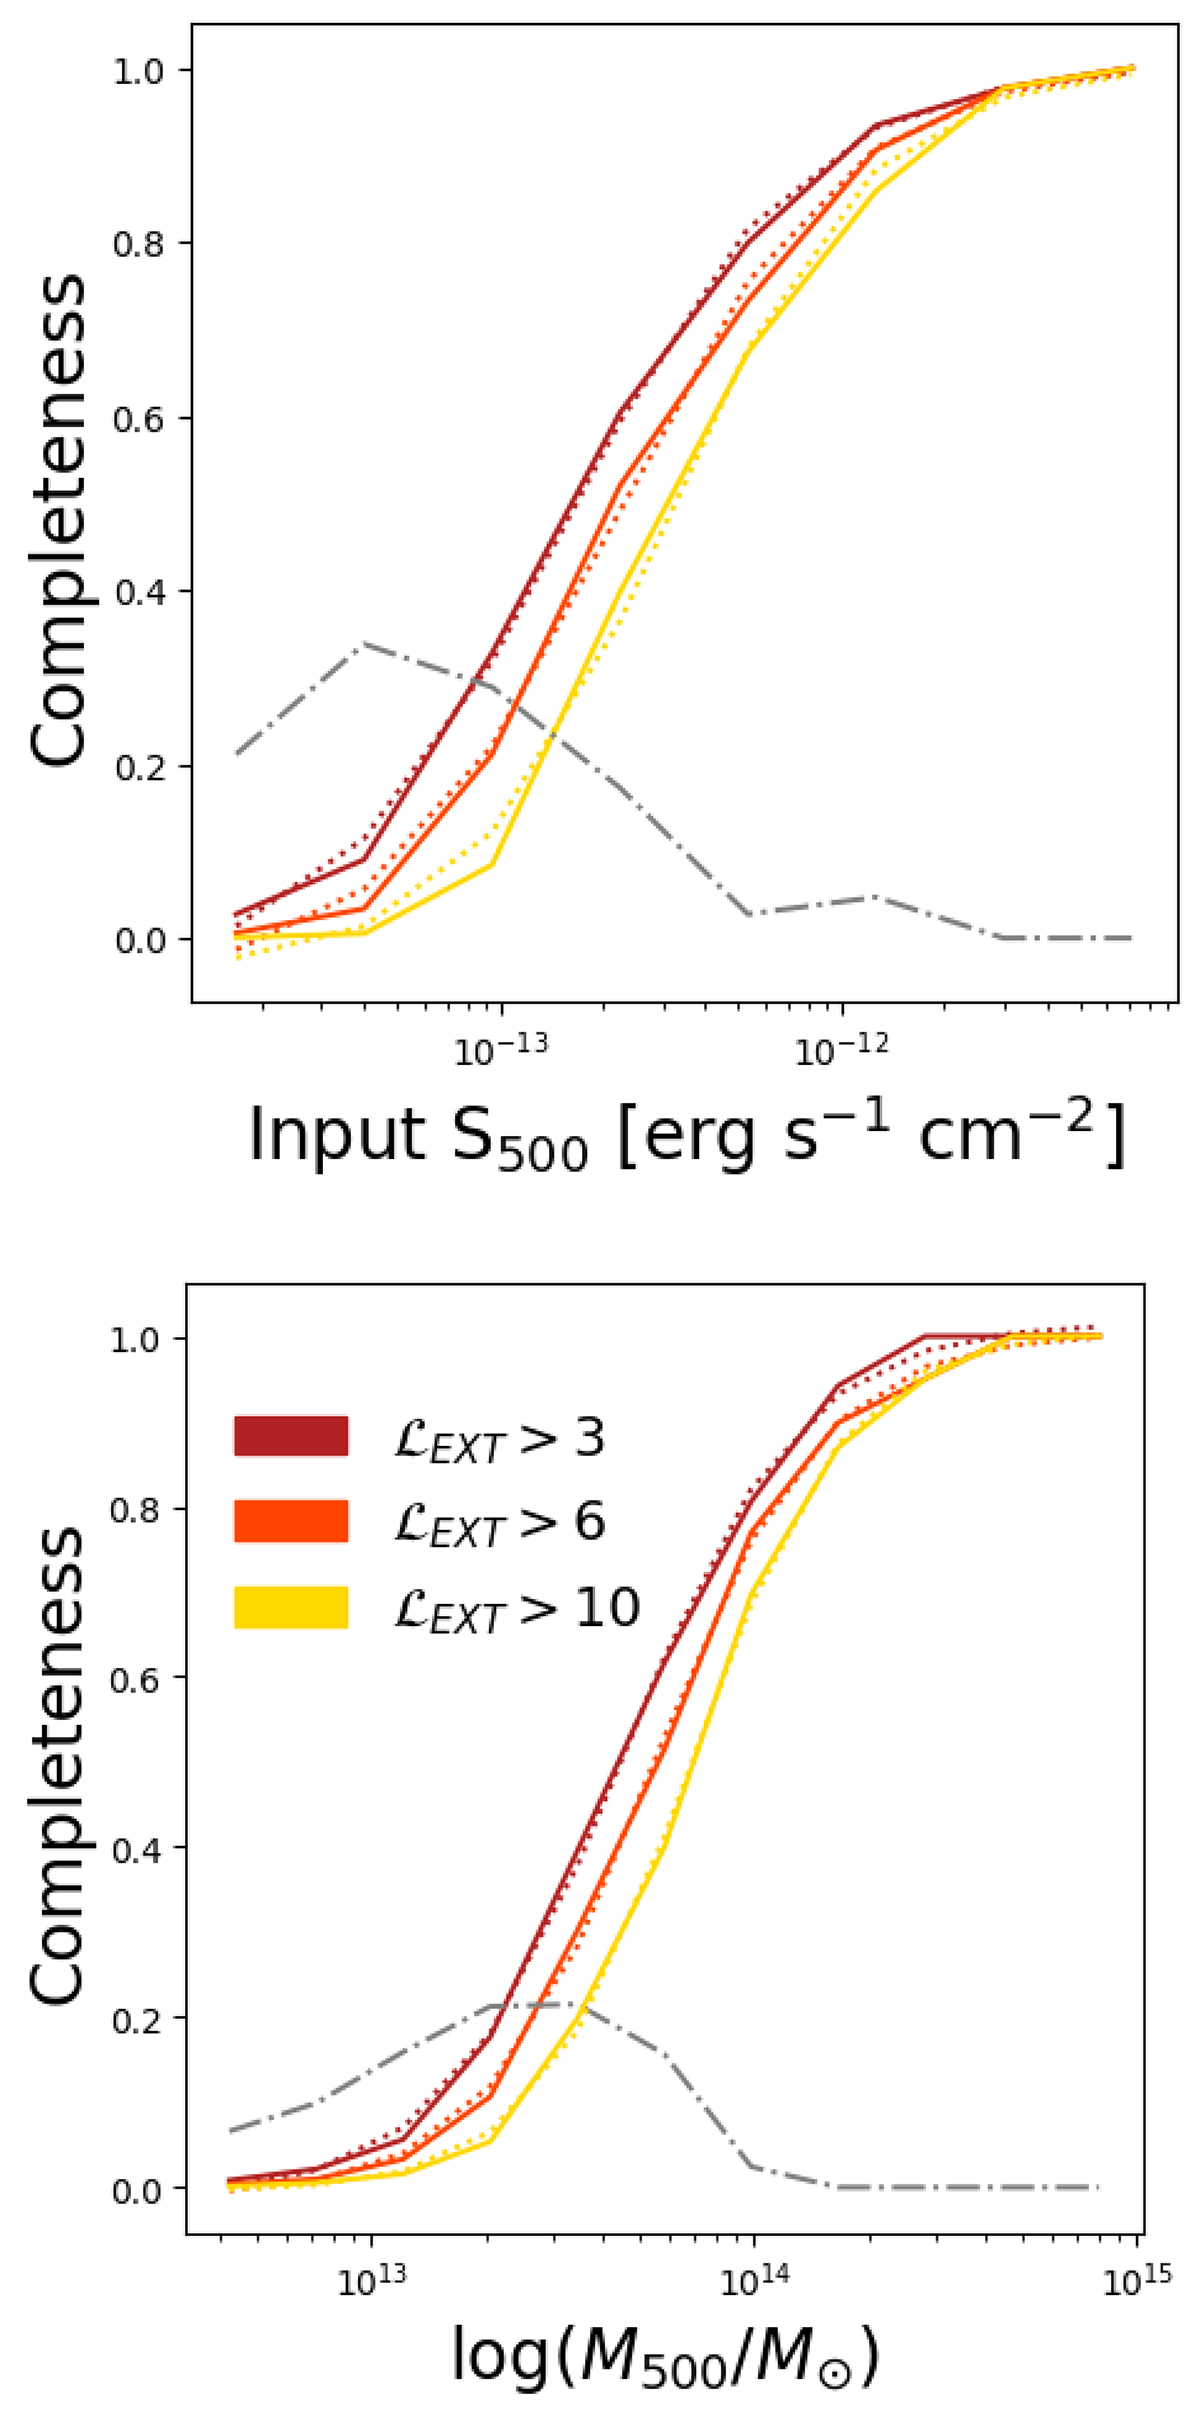
Fig. 4.
Download original image
Completeness profiles within the three different extent likelihood cuts (i.e. ℒEXT > 3, 6, 10). The completeness is defined in terms of the input flux S500 in the soft band (0.2 − 2.3 keV) in the top panel and the halo mass M500 in the bottom panel. We present the results for the sample with the extended (primary) detections with the solid lines. The dashed-dotted grey lines show the fraction of misclassified point sources: they are detections from the point source catalogue whose X-ray emission is at least 80% the IGrM in input. The coloured dotted lines are the best-fit curves.
Current usage metrics show cumulative count of Article Views (full-text article views including HTML views, PDF and ePub downloads, according to the available data) and Abstracts Views on Vision4Press platform.
Data correspond to usage on the plateform after 2015. The current usage metrics is available 48-96 hours after online publication and is updated daily on week days.
Initial download of the metrics may take a while.