Fig. 14.
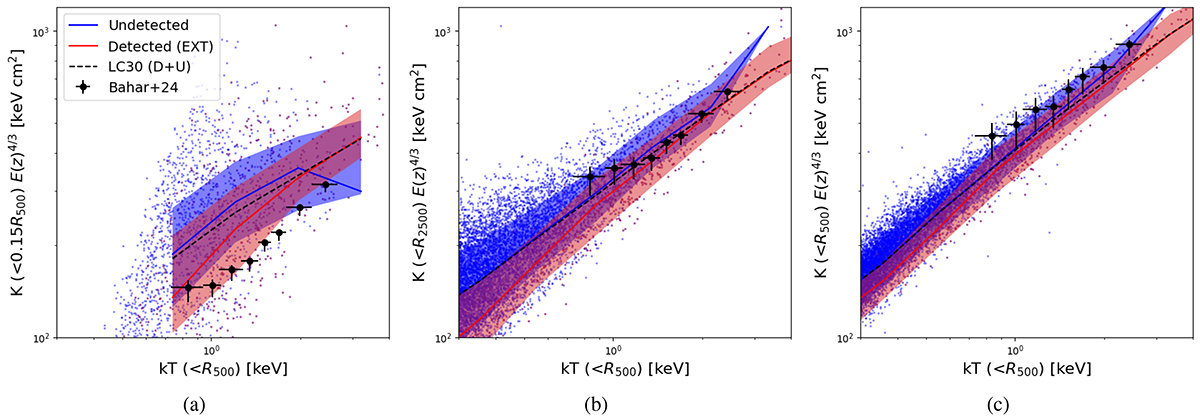
Download original image
Entropy within different radii as a function of the integrated temperature (within R500). The entropy is calculated for each halo as the ratio between the mass-weighted temperature and the electron density within that same radius. We calculate the running median for the detected (red), undetected (blue), and full sample (black). We plot the 25th − 75th percentiles with the shaded band. The black crosses represent the observational eRASS1 dataset from Bahar et al. (2024). The three images refer to three different radii (i.e. 0.15 R500, R2500, R500). We ensure halos host at least 80 gas particles within the selected aperture.
Current usage metrics show cumulative count of Article Views (full-text article views including HTML views, PDF and ePub downloads, according to the available data) and Abstracts Views on Vision4Press platform.
Data correspond to usage on the plateform after 2015. The current usage metrics is available 48-96 hours after online publication and is updated daily on week days.
Initial download of the metrics may take a while.