| Issue |
A&A
Volume 689, September 2024
|
|
|---|---|---|
| Article Number | A14 | |
| Number of page(s) | 9 | |
| Section | Interstellar and circumstellar matter | |
| DOI | https://doi.org/10.1051/0004-6361/202450325 | |
| Published online | 27 August 2024 | |
Detection of the [C I] λ8727 emission line
Low-ionization structures in NGC 7009
1
Institute for Astronomy, Astrophysics, Space Applications and Remote Sensing, National Observatory of Athens,
GR 15236
Penteli, Greece
Corresponding author; This email address is being protected from spambots. You need JavaScript enabled to view it.
2
Instituto de Física e Química, Universidade Federal de Itajubá,
Av. BPS 1303, Pinheirinho,
37500-903,
Itajubá, MG, Brazil
3
European Southern Observatory,
Karl-Schwarzschild Strasse 2,
85748
Garching, Germany
4
Observatório do Valongo, Universidade Federal do Rio de Janeiro,
Ladeira Pedro Antonio 43,
20080-090,
Rio de Janeiro, Brazil
5
Instituto de Astrofísica de Canarias,
38205
La Laguna, Tenerife, Spain
6
Departamento de Astrofísica, Universidad de La Laguna,
38206
La Laguna, Tenerife, Spain
Received:
11
April
2024
Accepted:
14
July
2024
Abstract
We report the first spatially resolved detection of the near-infrared [C I] λ8727 emission from the outer pair of low-ionization structures in the planetary nebula NGC 7009 from data obtained by the Multi Unit Spectroscopic Explorer integral field unit. This atomic carbon emission marks the transition zone between ionized and neutral gas and for the first time offers direct evidence that LISs are photodominated regions. The outer LIS pair exhibits intense [C I] λ8727 emission, but He I λ8733 is absent. Conversely, the inner pair of knots shows both lines, likely due to the host nebula emission. Furthermore, the [C I] λ8727 line is absent in the host nebula emission, but He I λ8733 is present. Although the origin of the [C I] λ8727 line is still debated, its detection supports the scenario of photoevaporated dense molecular clumps.
Key words: shock waves / ISM: atoms / photon-dominated region (PDR) / planetary nebulae: individual: NGC 7009
Corresponding author; This email address is being protected from spambots. You need JavaScript enabled to view it.
© The Authors 2024
 Open Access article, published by EDP Sciences, under the terms of the Creative Commons Attribution License (https://creativecommons.org/licenses/by/4.0), which permits unrestricted use, distribution, and reproduction in any medium, provided the original work is properly cited.
This article is published in open access under the Subscribe to Open model. This email address is being protected from spambots. You need JavaScript enabled to view it. to support open access publication.
1 Introduction
The origin of microstructures, such as knots, filaments, or jetlike features with a strong [N II] λ6584 emission line, that have been reported for a number of planetary nebulae (PNe) by Balick (1987) and it has been a long-standing problem in the PNe formation as well as stellar evolution. Corradi et al. (1996) demonstrated based on Hα+[N II]/[O III] CCD imaging that the low-ionization microstructures are far more common in PNe than we knew before. Based on their kinematic characteristics and expansion velocities, these structures occur in two main groups: (i) fast low-ionization emission regions (FLIERs, Balick et al. 1993), and (ii) slow-moving low-ionization emitting regions (SLOWERs, Perinotto 2000). In 2001, Gonçalves et al. (2001) integrated both classes into a more general category, called low-ionization structures (LISs), and conducted a thorough comparison between formation models and observations. When LISs are found in pairs, they are also known as ansae, that is, the knots at the tip of jet-like features along the major axis of the nebulae that are located at a nearly equal distance from the central star (e.g. NGC 3242, NGC 7009, Hb 4, Balick 1987; Soker 1990; García-Segura 1997).
Numerous studies of LISs have been carried out since they were first reported, either via spectroscopy or imaging (e.g. Balick et al. 1993, 1994, 1998, 2020; Hajian et al. 1997; Corradi et al. 1999, 2000a,b; Gonçalves et al. 2003, 2004b, 2006, 2009; Akras & Gonçalves 2016; Ali & Dopita 2017; Akras et al. 2022b; Mari et al. 2023a,b, among others). The interpretation of the enhanced [N II] emission from LISs relative to the surrounding nebular gas as a result of an overabundance of nitrogen (Balick et al. 1994) has been ruled out because most PNe present no difference in chemical composition between the LISs and the host PNe (e.g. Hajian et al. 1997; Gonçalves et al. 2006; Akras & Gonçalves 2016; Ali & Dopita 2017; Akras et al. 2022b; Mari et al. 2023a,b).
The intense ultraviolet (UV) radiation from the central stars of PNe and shocks between the nebular components or the interstellar medium have been suggested to explain the observed enhancement of low-ionization lines such as [N II] λ16548,6584, [S II] λλ6716,6731, and [O I] λ6300, which originate from LISs (e.g. Dopita 1997; Hajian et al. 1997; Gonçalves et al. 2003, 2004b; Akras & Gonçalves 2016; Ali & Dopita 2017; Mari et al. 2023a,b). No definitive conclusion has been reached so far.
The main difference between the LISs and the surrounding host nebulae is the electron density of the gas (ne). In particular, ne is systematically lower in LISs than in the nebular gas (e.g. Mari et al. 2023b). The detection of molecular hydrogen (H2) emission in LISs (Akras et al. 2017, 2020c; Fang et al. 2018) has unveiled an additional mass component, as proposed by (Gonçalves et al. 2009). Hence, LISs are most likely dense molecular clumps, in agreement with various formation models (e.g. Steffen et al. 2001; Raga et al. 2008; Balick et al. 2020).
This molecular component has only been directly associated with the cometary knots of the Helix (Matsuura et al. 2009; Andriantsaralaza et al. 2020), Dumbbell (Kwok et al. 2008), and Ring nebulae (Speck et al. 2003). Manchado and colleagues unveiled through adaptive optics imaging that the H2 emission that was previously detected in the equatorial region of the bipolar PN NGC 2346 (Arias et al. 2001) is fragmented into clumps and filaments (Manchado et al. 2015). More recently, the astonishing images from the James Webb Space Telescope (JWST) revealed the fragmentation of H2 emission into knots and filaments in NGC 3132 (De Marco et al. 2022) and NGC 6720 (Wesson et al. 2024).
Low-ionization structures have a typical size of 1016–1017 cm and are found in young PNe < 2000 yr, and the cometary knots are larger and are found in older PNe > 7000 yr (Akras et al. 2020b). Both are characterized by high core densities (nH > 105 cm−3) that shield the H2 gas against the photodissociating UV radiation (e.g O’Dell et al. 2005, 2007).
The pair of outer LISs in the archetypal PN NGC 7009 is of particular interest. The analysis of narrow-band near-IR imaging data has revealed high H2 1-0/2-1 and moderate H2 1-0/Brγ ratios, (see Fig. 6 in Akras et al. 2020b) which are both consistent with photoexcited and shock-excited gas. In addition to the H2 emission, [Fe II] λ1.644 μm emission has also been found to emanate from the same pair of LISs in NGC 7009 (Akras et al. 2024). The scenario of photoevaporating clumps is favored due to the spatial distribution and line stratification (Akras et al. 2022b).
In this paper, we add one more piece of evidence to solve the puzzling problem of LISs in PNe. We report the first detection of the near-infrared [C I] λ8727 emission line that is directly associated with the LISs in NGC 7009. In Sect. 2, we discuss the previous detections of the [C I] λ8727 line in PNe. The results of our analysis of NGC 7009 are described in Sect. 3. In Sect. 4, we discuss the origin of the [C I] λ8727 emission, and we conclude in Sect. 5.
2 Near-infrared C I emission lines in planetary and other nebulae
The emission lines from neutral carbon in the near-infrared (NIR, 750–3000 nm) such as [C I] λ8727 (5–>4) and λλ9824 (4–>2), 9850 (4–>3) were first detected in the highly ionized planetary nebula NGC 7027 by Danziger & Goad (1973) in 1973. NGC 7027 is a C-rich nebula with several carbon-based molecules such as CO, CH+, and C2H, which were found in spectra recorded with the photodetector Array Camera and Spectrometer (PACS) and Spectral and Photometric Imaging REceiver (SPIRE) (Wesson et al. 2010). The neutral [C I] emission lines likely originate from a dense and warm region in which CO is partially dissociated. The [C I] emission lines have also been detected in the far-infrared centered at 370.4 and 609.14 μm with Herschel, but the emission was not spatially resolved (NGC 7027; Wesson et al. 2010 or NGC 6781; Ueta et al. 2014).
Jewitt et al. (1983) carried out a [C I] survey of PNe and found that three (NGC 6210, NGC 6720, and NGC 7027) out of six PNe display [C I] emission lines in their spectra. The detection in NGC 6720 is particularly interesting. The [C I] λλ9824+9850 emission lines were found to be cospatial with the [O I] λ6300 line. All these emission lines originate from dense filaments distributed in the nebular shell. Collisions of carbons with free electrons were proposed to be the cause for the neutral carbon emission lines in NGC 6720. Jewitt et al. (1983) stated that the [C I] λ8727 emission line likely originates from regions of the PNe that are shielded from the UV radiation from the central nucleus. The spectroscopic study of NGC 7027 and NGC 6720 by Liu & Barlow (1996) confirmed the previous detection of the forbidden [C I] lines. The same authors also reported a cospatial distribution of the [C I] λ8727 and [N I] λ5200 lines for NGC 6720, suggesting that both lines emanate from the same partially ionized regions. Interestingly, the electron temperature computed from the [C I] lines (Te[C I]) was found to be systematically lower by 2000–3000 K than the temperatures obtained from the traditionally used diagnostic lines of [N II], [O III], and [S II]. This result is consistent with the decrease of Te in the denser regions of gas (Liu et al. 1995; Liu & Barlow 1996).
Liu et al. (1995) reported the detection of the [C I] λ8727 and λλ9824, 9850 lines in four additional PNe (NGC 2346, NGC 2440, NGC 3132, and IC 4406). Notably, molecular hydrogen lines have been reported for all four PNe (e.g. Storey 1984; Kastner et al. 1996; Hora et al. 1999; Arias et al. 2001; Manchado et al. 2015; Mata et al. 2016; De Marco et al. 2022).
Three possible mechanism were discussed as the cause of the emission of the NIR forbidden [C I] lines by Liu et al. (1995): (i) collisional excitation by electrons (Danziger & Goad 1973; Jewitt et al. 1983), (ii) recombination of C+ ions in a dense gas illuminated by an intense UV field (Escalante et al. 1991), and (iii) UV continuum fluorescence emission. The three mechanisms can be distinguished through the [C I] line ratio (R([C I]) = (λλ9824+9850)/λ8727, see Fig. 2 in Liu et al. 1995). R([C I]) > 10 implies a collisional excitation origin, while a ratio between 5 and 10, depending on Te, can be attributed to both collisional excitation and recombination processes. Collisional deexcitation may also have an impact on the line intensities of high-density regions (critical densities for the [C I] λ8727, λ9824, and λ9850 lines for Te = 1000 K are ~1.3×10⁷, ~1.4×10⁴, and ~1.4×104 cm−3, respectively). The pure UV fluorescence process yields line ratios close to the lower recombination bounds (~5), but significantly weaker emission line intensities (Liu et al. 1995). Additionally, Liu et al. found evidence that collisional excitation by electrons was the dominant mechanism that excited the [C I] lines in their four PNe.
The [C I] λ8727 and/or λλ9824,9850 emission lines, depending on the wavelength coverage of the spectrograph, were also detected in another 39 PNe that are listed in Table 1. The detection of the lines in the post-AGB star IRAS 11385-5517 indicates a nebula with a very low degree of ionization. All the aforementioned [C I] detections were made through long-slit spectroscopy, and the spatial extent of the regions that emitted these lines is still unknown. Interestingly, García-Rojas et al. (2022) presented similar spatially resolved [C I] λ8727 MUSE maps for the PNe NGC 6778 and M 1-42. Both PNe display a knotty structure in the NIR forbidden [C I] λ8727 line, which appears to be cospatial with the [O I] λ6300 and [N I] λ5200 lines. An additional pair of LISs in the PN NGC 3242 was found to emit the [C I] λ8727 line (Konstantinou et al. in preparation). It is truly intriguing that the [C I] λ8727 line has been found in a few LISs.
In addition to PNe, the same NIR neutral carbon lines were detected in the photodissociation regions (PDRs) of H II regions, such as NGC 2024 (Munch & Hippelein 1982), NGC 2023 (Burton et al. 1992), the Orion nebula (Munch & Hippelein 1982; Weilbacher et al. 2015), 30 Dor (Castro et al. 2018), M 17, and NGC 346 (Henney & Valerdi 2024). Burton et al. (1992) argued for NGC 2023 that the [C I] λ8727 and H2 lines originate from the same high-density (nH > 105 cm−3) gas in a PDR. Stock et al. (2011) reported the detection of the NIR carbon lines in the NGC 3199 nebula around the WR 18 Wolf-Rayet star. These authors argued that the recombination process for C ions is more likely than collisional excitation to explain the observed intensities of the lines.
Overall, [C I] is considered as a good tracer for H2 regions because the same energy photons can ionize C0 and O0 and dissociate H2. PDR modelling can naturally explain the common origin of the H2 [O I] and [C I] lines from a dense partially ionized and/or neutral gas with an optical depth Av < 2 (Tielens & Hollenbach 1985a,b; Hollenbach & Tielens 1999). Although a recombination of C+ ions is a plausible mechanism for the origin of the NIR neutral carbon lines in PDRs (Escalante et al. 1991; Munch & Hippelein 1982; Burton et al. 1992), collisional excitation in a partially ionized gas is more likely in PNe (Danziger & Goad 1973; Liu et al. 1995; Liu & Barlow 1996). The difference in the excitation mechanisms of [C I] lines in various environments is attributed to the strength of the UV radiation field and to the physical properties of the gas.
Moreover, the [C I] (λλ9824+9850)/λ8727 line ratio can also be used as a temperature diagnostic for neutral and partially ionized gas, similar to the [O I] diagnostic lines (λλ6300+6363)/λ5577).
Planetary nebulae in which the [C I] λ8727 and/or λλ9824, 9850 emission lines have been detected.
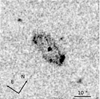 |
Fig. 1 [C I] λ8727 emission line in the MUSE map of NGC 7009 in 1 × 1 spatial binning. |
3 Near-infrared [C I] λ8727 emission line in NGC 7009
The fact that the outer pair of LISs in NGC 7009 shows enhanced [O I] λ6300 and [N I] λ5200 emission lines relative to the host nebula (Gonçalves et al. 2003; Walsh et al. 2018; Akras et al. 2022b) in conjunction with H2 emission (Akras et al. 2020a) motivated us to search in the Multi Unit Spectroscopic Explorer (MUSE, Bacon et al. 2010) integral field unit (IFU) data of NGC 7009 for the NIR [C I] λ8727 line. A potential detection of the [C I] line associated with the pair of knots would further support the scenario of photodominated knots, given that this line goes deeper into the molecular gas.
The MUSE IFU data cover an optical wavelength range from 480 to 930 nm1. This makes MUSE an ideal instrument for a search for the NIR [C I] λ8727 line in extended sources such as PNe. In Fig. 1, we present the first spatially resolved [C I] λ8727 map of NGC 7009, extracted from the MUSE data obtained for the 097.D-0241(A) program (PI: R. L. M. Corradi)2. The data acquisition and reduction for this program were detailed in García-Rojas et al. (2022). The sequence of target and sky observations, exposure times, air masses, and seeing conditions for NGC 7009 are shown in Table 2. The emission from the pairs of LISs as well as the inner ellipsoidal shell is readily discerned (Fig. 1).
It should be noted, however, that two more lines lie close to the [C I] line, namely the [Fe III] λ8729 and He I λ8733 lines. To verify the identification of the emission centered at 8727Å as the [C I] line and exclude the possibility of a misidentification or a contribution from the other lines, three Gaussian components were considered for the fitting process.
The upper panel in Fig. 2 displays the [C I] λ8727 line map extracted from the datacube with a 5×5 binning in the spatial dimensions (1.0×1.0″ spaxels) to increase the signal-to-noise ratio of the emission lines. The lower panels show the spectra in the wavelength range from 8720 to 8740 Å together with our best line fitting solution for six spaxels in the nebula, labeled k1 to k6 (Gonçalves et al. 2004b), which are indicated on the line map by red crosses. The two outer LISs (k1 and k4) clearly show an emission line centered at 8725–8726 Å. The inner LISs k2 and k3 exhibit two emission lines centered at 8725–8726 Å and 8732–8733 Å, respectively. At positions k5 and k6, we clearly obtain an emission line centered at ~8733 Å and a weak emission line at ~8726 Å, which is slightly stronger in LIS k5. The difference in the line wavelengths is attributed to the low spectral resolution data and motion of the LISs.
According to this analysis, we argue that the two outer LISs (k1 and k4) are characterized by an intense [C I] λ8727 emission, while the inner blobs (k2 and k3) exhibit a weaker [C I] λ8727 emission accompanied by a stronger He I λ8733 emission. The k5 LIS that lies closer to the central star is dominated by the recombination He I emission, but a weak emission from atomic carbon is noticeable. Interestingly, the k6 region, which represents the spectrum of the ellipsoidal nebula, only shows strong He I λ8733 emission. This implies different physical conditions and ionization levels between the LISs and the host nebula (Mari et al. 2023b). The He I λ8733 emission line detected in the k2, k3, and k5 LISs is probably associated with the superposed emission from the host nebula. The [Fe III] λ8729 line is only marginally found in k1, making its detection uncertain. It is worth mentioning, however, that the singly ionized lines [Fe II] λ8617 (Bouvis et al. in preparation) and [Fe II] 1.644 μm (Akras et al. 2024) have also been detected in LIS k1.
Fang & Liu (2011) presented a very deep spectrum of NGC 7009 covering a wavelength range from 3040 to 11 000 Å, with almost 1200 detected and identified emission lines. Several recombination lines of C+ ions were identified, as well as the two NIR forbidden [C I] lines at 9824 and 9850 Å. The authors did not report the detection of the [C I] λ8727 line, however. In contrast, the same authors reported the identification of the [Fe III] λ8729 and He I λ8733 lines. It is worth mentioning that the slit only covered the ellipsoidal inner shell of the nebula, centered 2–3 arcsec from the central star in the southern direction. Hence, the identification of the He I λ8733 by Fang & Liu (2011) agrees with our findings in the k6 region, while the report of the [Fe III] λ8729 line may be a misidentification of the [C I] λ8727 line in the k2 and k3 LISs.
The absence of the [C I] λ8727 line in the main nebula (k6) in conjunction with the detection of the [C I] λλ9824, 9850 by Fang & Liu (2011) implies a high [C I] ratio. For Te ~ 10 000 K and 5000 < ne < 10000 cm−3, both mechanisms are valid (the recombination of C+ or the collisional excitation by free electrons). In the case of 1000 < ne < 5000 cm−3, collisional excitation of atomic carbon is the most probable mechanism (see Fig. 2 in Liu et al. 1995). The high observed ne (between 3500 cm−3 and 10000 cm−3) reported for the main elliptical shell of NGC 7009 based on the [S II] λ6716/λ6731 diagnostic line ratio (e.g. Gonçalves et al. 2003, Gonçalves et al. 2006; Fang & Liu 2011; Walsh et al. 2018; Akras et al. 2022b; Lee et al. 2022; Hyung et al. 2023), indicates collisional excitation of C.
In Table 3, we list the intensities of some typical emission lines computed for the outer LISs, the inner blobs, and Fang’s slit from the MUSE data using the specific slit module in the code called Spectroscopic analysis tool for intEgraL fieLd unIt daTacubEs SATELLITE (Akras et al. 2022b). SATELLITE simulates the long-slit spectrum of Fang & Liu (2011) defining a pseudo-slit with similar sizes and placed at approximately the same position on the nebula. The intensity of the [Fe III] λ8729 line measured by Fang & Liu (2011) is comparable to the sum of the [C I] λ8727 and [Fe III] λ8729 lines for the same region (second and third columns of Table 3). When we combine the intensity of the [C I] λ8727 line from the MUSE data (third column in Table 3) with the [C I] λ9824 and λ9850 line intensities from Fang & Liu (2011), we obtain R([C I]) 2.2, which implies collisional excitation of C0 in high electron density gas (ne = 6–8×104 cm−3). This is orders of magnitude higher than the observed value (ne = 1300-1500 cm−3; Gonçalves et al. 2003; Walsh et al. 2018; Akras et al. 2022b). We thus argue that the [C I] λλ9824,9850 emission lines more likely originate from the inner and outer LISs.
The intensity of the [C I] λ8727 line in the outer LISs (Cols. 4 and 6) is higher by a factor of 15 (relative to the host nebula), similarly to other low-ionization lines (e.g., [N II] λ6584, [S II] λ6716, λ6731, and [O I] λ6300). When we assume that the [C I] λ9824 and λ9850 lines come only from the other LISs, R([C I]) becomes larger (highly uncertain, but close to 10). This is consistent with the recombination of singly ionized carbon or collision excitation in a gas with ne between 103 and 104 cm−3.
In Fig. 3, we present the spatial distribution of the [C I] λ8727/He I λ8733 line ratio from the MUSE data of NGC 7009 considering a signal-to-noise ratio >3. This map clearly shows that the central part of NGC 7009 is dominated by an intense He I λ8733 emission, while the outer LISs exhibit an enhanced [C I] λ8727 line emission.
Log of the MUSE observations of NGC 7009 in WFM-NOAO-E mode.
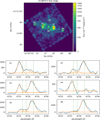 |
Fig. 2 Illustration of the spatial distribution of the atomic carbon that reveals the clumpy structures superimposed on the extended emission of NGC 7009. Upper panel: [C I] λ8727 line MUSE flux map at a 5×5 spatial binning. Six different clumpy structures on the nebula are indicated as red crosses and labeled from k1 to k6 (Gonçalves et al. 2004a). The color bar corresponds to the intensity of the emission line. Bottom panels: observed spectra (solid blue lines) in the range from 8720 to 8740 Å extracted from the six distinct spaxels in units of 10−20 erg s−1 cm−1 Å−1. The three emission lines in this particular spectral range are [C I] at 8727.1 Å, [Fe III] at 8728.8 Å, and He i at 8733.4 Å, and they were fitted assuming a Gaussian profile (dashed orange lines). The vertical dashed green lines indicate the wavelengths in the rest frame. |
Optical emission line fluxes from specific pseudo-slits or nebular regions(a).
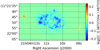 |
Fig. 3 [C I] λ8727/He I λ8733 line ratio map from MUSE data of NGC 7009. |
4 Discussion
By definition, LISs are characterized by enhanced low-ionization emission lines (relative to Hα) compared to the surrounding nebular gas. The detection of the H2 2.12 μm emission in LISs has unveiled the following structure: A thin layer of partially ionized gas that engulfs the molecular core.
The emission line stratification of the LISs in NGC 7009 has been demonstrated through the radial analysis of the nebula using the SATELLITE code (see Fig. 7 and Table 2 in Akras et al. 2022b). Low-ionization lines peak at 1 arcsec farther from the central star than the moderate- to high-ionization lines.
Figure 4 displays the isocontours, normalized to the maximum intensity, of several emission lines found to emanate from knot k1, overlaid on the [N II] λ6584 line map from MUSE. The bottom left panel shows the distribution of the Hα (solid red), Brγ (dashed red), and H2 (yellow) emission lines obtained from Akras et al. (2020a). The Hα and Brγ lines are cospatial, as expected, and extend in the western direction. The spatial offset between the Hα and Brγ emission with the H2 emission is easily discerned. The lower right panel shows the isocontours of the maximum intensity of more lines. The stratification of the emission lines is evident. The [O III] emission peaks closer to the central star, followed by the [S II] and [N II] emission, the cospatial [C I], [O I], [Fe II] emission, and finally, the H2 emission at a larger distance from the central star.
This emission line stratification is expected for a clump illuminated by an external radiation source (see a scheme of this scenario in the upper panel in Fig. 5), but it contradicts the scenario of shock-excited bullets that move outward and interact with the AGB remnant or the interstellar medium (lower panel in Fig. 5). In the latter case, the stratification of the emission lines should be in the opposite direction. In particular, the high- to moderate-ionization emission should lie just behind the shock front, followed by the low-ionization emission, as the temperature of the gas decreases with the distance from the shock front. The schematic cartoons in Fig. 5 illustrate the case of a UV-illuminated (photoevaporation) and a shock-excited clump. Representative examples of the emission line stratification in a shock-excited gas are also provided by Bocchino et al. (2000) and Alarie & Drissen (2019).
Shocks are usually unveiled by enhanced [O III]/Hα line ratios, which reflect the increase in Te. Guerrero et al. (2013) discussed the enhancement of the [O III]/Hα ratio in PNe and pointed out that it is more frequent in bipolar outflows, expanding shells, and clumps. Particularly for NGC 7009, an enhancement of the [O III]/Hα ratio as well as Te [S III] has been observed at the outer edges of the LISs from the HST line images (Guerrero et al. 2013) and in MUSE line maps (Walsh et al. 2018; Akras et al. 2022b).
The radial analysis of NGC 7009 with the SATELLITE code also revealed an increase in Te([S III]) by approximately 1000 K at the position of LISs, where the [O III]/Hα ratio becomes higher. This increase in the [O III]/Hα ratio might be associated with a shock-heated gas. We recall that the emission of molecular hydrogen in the LISs of NGC 7009 has been attributed to the UV-pumping process in highly dense gas (>104 cm−3, Akras et al. 2020a), and high densities like this have been reported by Lee et al. (2022); Hyung et al. (2023), but shocks have not yet been ruled out. Shocks contribute little to the total H2 emission compared to the UV (Natta & Hollenbach 1998).
Shock interaction is not the only process that can lead to the heating of the gas. In PDRs and PNe with a significant number of small dust grains, the effect of the photoelectric heating by dust grains becomes very strong and may cause the increase in the [O III]/Hα ratio (Hollenbach et al. 1991; Dopita & Sutherland 2000; Stasińska & Szczerba 2001). According to these studies, photoelectric heating can provide a natural explanation for several problems: (i) the temperature gradient in PNe, (ii) the discrepancy in the [O I] λ6300 between the observations and models, and (iii) the systematically lower Te obtained from the Balmerjump, and otherdiagnostics. Molecular hydrogen in LISs also implies the presence of dust. UV shielding by dust may be significant, but more importantly, dust is needed to form H2.
Near-infrared neutral [C I] lines are important coolants in PDRs (Burton et al. 1992), and they define the transition zone between the ionized and neutral gas (Tielens & Hollenbach 1985a,b; Hollenbach & Tielens 1999). The detection of the [C I] 18727 line, which we reported here for the first time in LISs, has added a new piece to the puzzling problem of their origin. The question is whether the [C I] emission indicates that a considerable amount of hidden atomic carbon is stored in these microstructures, or if it is associated with the dissociation of CO (Gonçalves et al., in preparation).
Considering the intense UV radiation field from the central stars in PNe, the photoevaporation of dense molecular clumps (Mellema et al. 1998) is possible. The stellar UV radiation illuminates the inner part of the dense clumps and results in the formation of a photoevaporating flow that moves backward. The moderate ionization lines emerge from this particular gas and display a peak closer to the central star, while the low-ionization lines originate from a region closer to the molecular core (at a larger distance from the central star) where the UV field is attenuated. The spatial distributions of the [O I] 6300/Hα and [N I] 5200/Hα line ratios at the outer LISs of NGC 7009 exhibit higher values deeper in their cores (Akras et al. 2022a). In addition to the optical emission, the H2 emission from the outer LISs peaks at an even larger distance than the low-ionization lines (see Fig. 4).
The estimated spatial offset between the H2 and Brγ line emissions from the LISs in NGC 7009 is ~1.2 arcsec, which corresponds to ~2.0×1016 cm adopting a distance of 1180 pc (Bailer-Jones et al. 2021) based on the Gaia EDR3 parallaxes (Gaia Collaboration 2021). A comparable spatial offset between the peaks of the H2 1-0 and Brγ lines of about 1016 cm has also been reported in molecular clouds of star-forming regions and was attributed to the photoevaporation of gas (e.g. IC 1396, Cygnus OB2, and the Carina nebula; Hartigan et al. 2015; Carlsten & Hartigan 2018).
According to the photoevaporation model of Carlsten & Hartigan (2018), the offset between the H2 1-0 and Brγ line becomes smaller when the flux of ionizing photons increases or the illuminated clumps become smaller. For the central star of NGC 7009 (Teff = 80000–90000 K and log(L/L⊙) = 3.5–3.73; Sabbadin et al. 2004; Gonçalves et al. 2006), the flux of the incident ionizing photons, F (photons cm−2 s−1), at the surface of the k1 knot with a radius of rc = 2×1016 cm (Akras et al. 2020b) and at a distance of r = 3.8×1017 cm (22.6 arcsec) from the central star, is log(F) ~ 18. Although the photoevaporation model is limited to log(F) = 13.25 and the clump radius is limited to rc ≥ 1017 cm (see Fig. 17 in Carlsten & Hartigan 2018), we claim that the modeled offset for the parameters of NGC 7009 could be as low as 1016 cm, which is comparable with the observations.
The spatial offset between the [S II] and Hα line emissions at knot k1 has also been computed as ~2.0×1016 cm (~1.2 arcsec, see Fig. 4 and Akras et al. 2022b). Hartigan et al. (2015) has measured comparable spatial offsets between the [S II] and Hα line emissions in molecular clouds of star-forming regions. In both cases, the Hα line displays a peak closer to the UV source.
According to the photoevaporation scenario, the presence of atomic carbon in gaseous state in clumps may imply the presence of the CO molecule, which is being dissociated by the UV radiation from the central star. However, CO emission has not yet been found in LISs (Gonçalves et al. in preparation), except for the cometary knots in the Helix (Huggins et al. 1992, 2002; Andriantsaralaza et al. 2020).
Another possible mechanism that can also lead to the emission of neutral carbon in gaseous state is shock waves. Evidence for shocks (either J- or C-type) have been found in Herbig-Haro (HH) objects through the detection of the H2, [Fe II] 1.644 μm and [C I] λλ9830,9850 emission lines (Smith 1994; Smith et al. 2003; McCoey et al. 2004). To account for the emission of [Fe II] and [C I] lines in HH objects, McCoey et al. (2004) assumed that Fe and C are first released from the dust grains into the gas phase by the passage of a C-type shock with a velocity between 25 and 45 km s−1 in high-density (104 cm−3 ) gas (May et al. 2000). The [C I] λ8727/[Fe II] 1.644 μm and [C I] λ8727/H2 2.12 μm line ratios for the k1 LIS in NGC 7009 were computed to be 0.125 and 0.05, respectively Akras et al. (2020a), and they were found to be comparable with the observed and modeled ratio for HH99 (McCoey et al. 2004). However, quantitative PDR and shock models that provide predictions for the intensities of the [Fe II] 1.644 μm, H2 2.12 μm, and [C I] λλ8727,9850, among other low-ionization lines, are needed for the proper investigation of k1 and other LISs. Because of the outward motion of a clump and its interaction with the AGB envelope or interstellar medium (ISM), shock-heated gas does not result in the observed emission line stratification.
It is important to point out that low-velocity shock waves are also present in the photoevaporation process. As the photoevaporating flow moves backward with respect to the direction of the k1 LIS, it interacts with the stellar wind and forms a forward- and a reverse-shock wave (see e.g. Mellema et al. 1998; Bron et al. 2018). This particular reverse shock sweeps up the material in the LIS or clump, and it might cause the release of C and Fe from the dust grains into the gas phase. Shock waves with velocities <50 km s−1, depending on dust grain size and composition, are sufficient for grain destruction to some extent and for the release of elements into the gas phase (e.g. Jones et al. 1994; May et al. 2000).
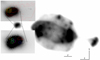 |
Fig. 4 Radial ionization stratification in the LISs of NGC 7009. Isocontours normalized to the maximum value of the emission lines at the position of knot k1, overlaid on the MUSE [N II] 16584 emission line map from Akras et al. (2022b). Upper left panel: Hα (red), Brγ (dashed red) and H2 (yellow) emission lines. Lower left panel: Brγ and H2 (dashed red and yellow; Akras et al. 2020a), [Fe II] (cyan; Akras et al. 2024), [O I], [S II] and [O III] (dashed green, magenta and blue, respectively; Akras et al. 2022b) and [C I] (green, this work). The field of view of the upper and lower panels is 7.5×6 arcsec and 6.5×4.8 arcsec, respectively. The arrow indicates the direction of the central star. North is up and east is to the left. |
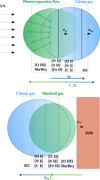 |
Fig. 5 Schematic representation of the emission line stratification in a photoevaporated (upper panel) and shock-heated due to the interaction with nebular gas or ISM (lower panel) clump. The dashed green arrows and green region represent the photoevaporative flow due to the illumination of the clump (blue region) by the UV stellar radiation field (black arrows) and the shock-heated gas by the reverse shock propagating into the clump as well as the shock-heated gas in case of an interaction with the surrounding medium due to the outward motion of the clump. The solid blue and green arrows at the bottom of each cartoon show the increase in the extinction Av, Te, and ne, respectively. uIF and uS F correspond to the velocity of the ionization and shock fronts, respectively. |
5 Conclusions
We presented the first spatially resolved [C I] λ8727 emission line map of the planetary nebula NGC 7009 extracted from the MUSE datacube. [C I] λ8727 emission is mainly detected at LIS pairs. The identification of the emission line was verified by comparing the spectra in six different regions. The outer LIS pair is characterized by a strong [C I] λ8727 line and a three times fainter He I λ8733, while the core nebula is mainly characterized by the He I λ8733 line. We cannot determine the mechanism (collision or recombination) through which the [C I] line is emitted based on the data we used.
Nevertheless, the detection of the forbidden [C I] λ8727 line in the LISs, an important coolant in PDRs, provides additional evidence to support the scenario in which LISs are lowionization dense molecular structures surrounded by a partially ionized or neutral gas. The observed stratification in the LISs of NGC 7009 disagrees with the result of shock interaction with the surrounding medium, but it is consistent with the outcome from the photoevaporation of a molecular clump illuminated by the UV radiation from the central star. The interaction of the inward photoevaporated gas with the outward stellar wind may result in a weak reverse-shock wave that causes the enhanced emission from low-ionization species. High spatial resolution observations are required to enrich our understanding of LISs in PNe.
Acknowledgements
We would like to thank the anonymous referee for his/her detailed report on the manuscript, which indeed helped us to significantly improve the paper. The research project is implemented in the framework of H.F.R.I call “Basic research financing (Horizontal support of all Sciences)” under the National Recovery and Resilience Plan “Greece 2.0” funded by the European Union - NextGenerationEU (H.F.R.I. Project Number: 15665). SA and LK acknowledge support from H.F.R.I. DRG acknowledges FAPERJ (E-26/211.370/2021; E-26/211.527/2023) and CNPq (403011/2022-1; 315307/2023-4) grants. J.G-.R. acknowledges financial support from the Spanish Ministry of Science and Innovation (MICINN) through the Spanish State Research Agency, under Severo Ochoa Centres of Excellence Programme 2020-2023 (CEX2019-000920-S). The authors would like to acknowledge Dr. Henri Boffin for the reduction of the MUSE data. The following software packages in Python were used: Matplotlib (Hunter 2007), NumPy (van der Walt et al. 2011), SciPy (Virtanen et al. 2020) and AstroPy Python (Astropy Collaboration 2013, 2018).
Data availability
The data are available upon request to the corresponding author. The observations are also available in the ESO Archive.
References
- Akras, S., & Gonçalves, D. R. 2016, MNRAS, 455, 930 [NASA ADS] [CrossRef] [Google Scholar]
- Akras, S., Gonçalves, D. R., & Ramos-Larios, G. 2017, MNRAS, 465, 1289 [NASA ADS] [CrossRef] [Google Scholar]
- Akras, S., Gonçalves, D. R., Ramos-Larios, G., & Aleman, I. 2020a, MNRAS, 493, 3800 [NASA ADS] [CrossRef] [Google Scholar]
- Akras, S., Gonçalves, D. R., Ramos-Larios, G., & Aleman, I. 2020b, Galaxies, 8, 30 [NASA ADS] [CrossRef] [Google Scholar]
- Akras, S., Monteiro, H., Aleman, I., et al. 2020c, MNRAS, 493, 2238 [NASA ADS] [CrossRef] [Google Scholar]
- Akras, S., Monteiro, H., Walsh, J., et al. 2022a, Galaxies, 10, 27 [NASA ADS] [CrossRef] [Google Scholar]
- Akras, S., Monteiro, H., Walsh, J. R., et al. 2022b, MNRAS, 512, 2202 [NASA ADS] [CrossRef] [Google Scholar]
- Akras, S., Aleman, I., Gonçalves, D. R., Ramos-Larios, G., & Bouvis, K. 2024, A&A, in press, https://doi.org/18.1851/8884-6361/282449588 [Google Scholar]
- Alarie, A., & Drissen, L. 2019, MNRAS, 489, 3042 [NASA ADS] [CrossRef] [Google Scholar]
- Ali, A., & Dopita, M. A. 2017, PASA, 34, e036 [NASA ADS] [CrossRef] [Google Scholar]
- Andriantsaralaza, M., Zijlstra, A., & Avison, A. 2020, MNRAS, 491, 758 [NASA ADS] [CrossRef] [Google Scholar]
- Arias, L., Rosado, M., Salas, L., & Cruz-Gonzâlez, I. 2001, AJ, 122, 3293 [CrossRef] [Google Scholar]
- Astropy Collaboration (Robitaille, T. P., et al.) 2013, A&A, 558, A33 [NASA ADS] [CrossRef] [EDP Sciences] [Google Scholar]
- Astropy Collaboration (Price-Whelan, A. M., et al.) 2018, AJ, 156, 123 [Google Scholar]
- Bacon, R., Accardo, M., Adjali, L., et al. 2010, SPIE Conf. Ser., 7735, 773508 [Google Scholar]
- Bailer-Jones, C. A. L., Rybizki, J., Fouesneau, M., Demleitner, M., & Andrae, R. 2021, AJ, 161, 147 [Google Scholar]
- Balick, B. 1987, AJ, 94, 671 [NASA ADS] [CrossRef] [Google Scholar]
- Balick, B., Rugers, M., Terzian, Y., & Chengalur, J. N. 1993, ApJ, 411, 778 [NASA ADS] [CrossRef] [Google Scholar]
- Balick, B., Perinotto, M., Maccioni, A., Terzian, Y., & Hajian, A. 1994, ApJ, 424, 800 [NASA ADS] [CrossRef] [Google Scholar]
- Balick, B., Alexander, J., Hajian, A. R., et al. 1998, AJ, 116, 360 [NASA ADS] [CrossRef] [Google Scholar]
- Balick, B., Frank, A., & Liu, B. 2020, ApJ, 889, 13 [CrossRef] [Google Scholar]
- Bocchino, F., Maggio, A., Sciortino, S., & Raymond, J. 2000, A&A, 359, 316 [NASA ADS] [Google Scholar]
- Bron, E., Agúndez, M., Goicoechea, J. R., & Cernicharo, J. 2018, A&A submitted [arXiv:1801.01547] [Google Scholar]
- Burton, M. G., Bulmer, M., Moorhouse, A., Geballe, T. R., & Brand, P. W. J. L. 1992, MNRAS, 257, 1P [NASA ADS] [CrossRef] [Google Scholar]
- Carlsten, S. G., & Hartigan, P. M. 2018, ApJ, 869, 77 [NASA ADS] [CrossRef] [Google Scholar]
- Castro, N., Crowther, P. A., Evans, C. J., et al. 2018, A&A, 614, A147 [NASA ADS] [CrossRef] [EDP Sciences] [Google Scholar]
- Corradi, R. L. M., Manso, R., Mampaso, A., & Schwarz, H. E. 1996, A&A, 313, 913 [NASA ADS] [Google Scholar]
- Corradi, R. L. M., Perinotto, M., Villaver, E., Mampaso, A., & Gonçalves, D. R. 1999, ApJ, 523, 721 [NASA ADS] [CrossRef] [Google Scholar]
- Corradi, R. L. M., Gonçalves, D. R., Villaver, E., et al. 2000a, ApJ, 535, 823 [NASA ADS] [CrossRef] [Google Scholar]
- Corradi, R. L. M., Gonçalves, D. R., Villaver, E., Mampaso, A., & Perinotto, M. 2000b, ApJ, 542, 861 [CrossRef] [Google Scholar]
- Danziger, I. J., & Goad, L. E. 1973, Astrophys. Lett., 14, 115 [NASA ADS] [Google Scholar]
- De Marco, O., Akashi, M., Akras, S., et al. 2022, Nat. Astron., 6, 1421 [Google Scholar]
- Dopita, M. A. 1997, ApJ, 485, L41 [CrossRef] [Google Scholar]
- Dopita, M. A., & Sutherland, R. S. 2000, ApJ, 539, 742 [NASA ADS] [CrossRef] [Google Scholar]
- Dopita, M. A., Ali, A., Sutherland, R. S., Nicholls, D. C., & Amer, M. A. 2017, MNRAS, 470, 839 [NASA ADS] [CrossRef] [Google Scholar]
- Escalante, V., Sternberg, A., & Dalgarno, A. 1991, ApJ, 375, 630 [NASA ADS] [CrossRef] [Google Scholar]
- Fang, X., & Liu, X. W. 2011, MNRAS, 415, 181 [NASA ADS] [CrossRef] [Google Scholar]
- Fang, X., Zhang, Y., Kwok, S., et al. 2018, ApJ, 859, 92 [NASA ADS] [CrossRef] [Google Scholar]
- Gaia Collaboration (Brown, A. G. A., et al.) 2021, A&A, 649, A1 [NASA ADS] [CrossRef] [EDP Sciences] [Google Scholar]
- García-Rojas, J., Peña, M., Morisset, C., Mesa-Delgado, A., & Ruiz, M. T. 2012, A&A, 538, A54 [NASA ADS] [CrossRef] [EDP Sciences] [Google Scholar]
- García-Rojas, J., Madonna, S., Luridiana, V., et al. 2015, MNRAS, 452, 2606 [CrossRef] [Google Scholar]
- García-Rojas, J., Delgado-Inglada, G., García-Hernández, D. A., et al. 2018, MNRAS, 473, 4476 [CrossRef] [Google Scholar]
- García-Rojas, J., Morisset, C., Jones, D., et al. 2022, MNRAS, 510, 5444 [CrossRef] [Google Scholar]
- García-Segura, G. 1997, ApJ, 489, L189 [NASA ADS] [CrossRef] [Google Scholar]
- Gonçalves, D. R., Corradi, R. L. M., & Mampaso, A. 2001, ApJ, 547, 302 [CrossRef] [Google Scholar]
- Gonçalves, D. R., Corradi, R. L. M., Mampaso, A., & Perinotto, M. 2003, ApJ, 597, 975 [CrossRef] [Google Scholar]
- Gonçalves, D. R., Corradi, R. L. M., Mampaso, A., & Perinotto, M. 2004a, ApJ, 601, 1161 [CrossRef] [Google Scholar]
- Gonçalves, D. R., Mampaso, A., Corradi, R. L. M., et al. 2004b, MNRAS, 355, 37 [CrossRef] [Google Scholar]
- Gonçalves, D. R., Ercolano, B., Carnero, A., Mampaso, A., & Corradi, R. L. M. 2006, MNRAS, 365, 1039 [CrossRef] [Google Scholar]
- Gonçalves, D. R., Mampaso, A., Corradi, R. L. M., & Quireza, C. 2009, MNRAS, 398, 2166 [CrossRef] [Google Scholar]
- Guerrero, M. A., Toalá, J. A., Medina, J. J., et al. 2013, A&A, 557, A121 [NASA ADS] [CrossRef] [EDP Sciences] [Google Scholar]
- Hajian, A. R., Balick, B., Terzian, Y., & Perinotto, M. 1997, ApJ, 487, 304 [NASA ADS] [CrossRef] [Google Scholar]
- Hartigan, P., Reiter, M., Smith, N., & Bally, J. 2015, AJ, 149, 101 [NASA ADS] [CrossRef] [Google Scholar]
- Henney, W. J., & Valerdi, M. 2024, MNRAS, 529, 1723 [CrossRef] [Google Scholar]
- Hollenbach, D. J., & Tielens, A. G. G. M. 1999, Rev. Mod. Phys., 71, 173 [Google Scholar]
- Hollenbach, D. J., Takahashi, T., & Tielens, A. G. G. M. 1991, ApJ, 377, 192 [NASA ADS] [CrossRef] [Google Scholar]
- Hora, J. L., Latter, W. B., & Deutsch, L. K. 1999, ApJS, 124, 195 [NASA ADS] [CrossRef] [Google Scholar]
- Huggins, P. J., Bachiller, R., Cox, P., & Forveille, T. 1992, ApJ, 401, L43 [NASA ADS] [CrossRef] [Google Scholar]
- Huggins, P. J., Forveille, T., Bachiller, R., et al. 2002, ApJ, 573, L55 [NASA ADS] [CrossRef] [Google Scholar]
- Hunter, J. D. 2007, Comput. Sci. Eng., 9, 90 [NASA ADS] [CrossRef] [Google Scholar]
- Hyung, S., & Aller, L. H. 1997a, MNRAS, 292, 71 [CrossRef] [Google Scholar]
- Hyung, S., & Aller, L. H. 1997b, ApJ, 491, 242 [NASA ADS] [CrossRef] [Google Scholar]
- Hyung, S., Aller, L. H., Feibelman, W. A., Lee, W. B., & de Koter, A. 2000, MNRAS, 318, 77 [CrossRef] [Google Scholar]
- Hyung, S., Aller, L. H., Feibelman, W. A., & Lee, S.-J. 2001, ApJ, 563, 889 [NASA ADS] [CrossRef] [Google Scholar]
- Hyung, S., Lee, S.-J., & Otsuka, M. 2023, ApJS, 265, 2 [NASA ADS] [CrossRef] [Google Scholar]
- Jewitt, D. C., Kupferman, P. N., Danielson, G. E., & Maran, S. P. 1983, ApJ, 268, 683 [NASA ADS] [CrossRef] [Google Scholar]
- Jones, A. P., Tielens, A. G. G. M., Hollenbach, D. J., & McKee, C. F. 1994, ApJ, 433, 797 [NASA ADS] [CrossRef] [Google Scholar]
- Kastner, J. H., Weintraub, D. A., Gatley, I., Merrill, K. M., & Probst, R. G. 1996, ApJ, 462, 777 [NASA ADS] [CrossRef] [Google Scholar]
- Kwok, S., Chong, S.-N., Koning, N., Hua, T., & Yan, C.-H. 2008, ApJ, 689, 219 [Google Scholar]
- Lee, S.-J., Hyung, S., & Otsuka, M. 2022, ApJ, 938, 71 [NASA ADS] [CrossRef] [Google Scholar]
- Liu, X. W., & Barlow, M. J. 1996, MNRAS, 279, 511 [CrossRef] [Google Scholar]
- Liu, X. W., Barlow, M. J., Danziger, I. J., & Clegg, R. E. S. 1995, MNRAS, 273, 47 [NASA ADS] [CrossRef] [Google Scholar]
- Madonna, S., García-Rojas, J., Sterling, N. C., et al. 2017, MNRAS, 471, 1341 [CrossRef] [Google Scholar]
- Manchado, A., Stanghellini, L., Villaver, E., et al. 2015, ApJ, 808, 115 [NASA ADS] [CrossRef] [Google Scholar]
- Mari, M. B., Gonçalves, D. R., & Akras, S. 2023a, MNRAS, 518, 3908 [Google Scholar]
- Mari, M. B., Akras, S., & Gonçalves, D. R. 2023b, MNRAS, 525, 1998 [NASA ADS] [CrossRef] [Google Scholar]
- Mata, H., Ramos-Larios, G., Guerrero, M. A., et al. 2016, MNRAS, 459, 841 [NASA ADS] [CrossRef] [Google Scholar]
- Matsuura, M., Speck, A. K., McHunu, B. M., et al. 2009, ApJ, 700, 1067 [NASA ADS] [CrossRef] [Google Scholar]
- May, P. W., Pineau des Forêts, G., Flower, D. R., et al. 2000, MNRAS, 318, 809 [NASA ADS] [CrossRef] [Google Scholar]
- McCoey, C., Giannini, T., Flower, D. R., & Caratti o Garatti, A. 2004, MNRAS, 353, 813 [CrossRef] [Google Scholar]
- Mellema, G., Raga, A. C., Canto, J., et al. 1998, A&A, 331, 335 [NASA ADS] [Google Scholar]
- Munch, G., & Hippelein, H. 1982, Ann. New York Acad. Sci., 395, 170 [NASA ADS] [CrossRef] [Google Scholar]
- Natta, A., & Hollenbach, D. 1998, A&A, 337, 517 [NASA ADS] [Google Scholar]
- O’Dell, C. R., Henney, W. J., & Ferland, G. J. 2005, AJ, 130, 172 [CrossRef] [Google Scholar]
- O’Dell, C. R., Henney, W. J., & Ferland, G. J. 2007, AJ, 133, 2343 [CrossRef] [Google Scholar]
- Otsuka, M., & Hyung, S. 2019, MNRAS, 491, 2959 [Google Scholar]
- Otsuka, M., Tajitsu, A., Hyung, S., & Izumiura, H. 2010, ApJ, 723, 658 [NASA ADS] [CrossRef] [Google Scholar]
- Otsuka, M., Kemper, F., Leal-Ferreira, M. L., et al. 2016, MNRAS, 462, 12 [NASA ADS] [CrossRef] [Google Scholar]
- Otsuka, M., Parthasarathy, M., Tajitsu, A., & Hubrig, S. 2017, ApJ, 838, 71 [CrossRef] [Google Scholar]
- Otsuka, M., Ueta, T., & Tajitsu, A. 2023, PASJ, 75, 1280 [NASA ADS] [CrossRef] [Google Scholar]
- Perinotto, M. 2000, Ap&SS, 274, 205 [NASA ADS] [CrossRef] [Google Scholar]
- Raga, A. C., Riera, A., Mellema, G., Esquivel, A., & Velázquez, P. F. 2008, A&A, 489, 1141 [NASA ADS] [CrossRef] [EDP Sciences] [Google Scholar]
- Rauber, A. B., Copetti, M. V. F., & Krabbe, A. C. 2014, A&A, 563, A42 [NASA ADS] [CrossRef] [EDP Sciences] [Google Scholar]
- Sabbadin, F., Turatto, M., Cappellaro, E., Benetti, S., & Ragazzoni, R. 2004, A&A, 416, 955 [NASA ADS] [CrossRef] [EDP Sciences] [Google Scholar]
- Sharpee, B., Baldwin, J. A., & Williams, R. 2004, ApJ, 615, 323 [NASA ADS] [CrossRef] [Google Scholar]
- Sivarani, T., Parthasarathy, M., García-Lario, P., Manchado, A., & Pottasch, S. R. 1999, A&AS, 137, 505 [NASA ADS] [CrossRef] [EDP Sciences] [Google Scholar]
- Smith, M. D. 1994, A&A, 289, 256 [NASA ADS] [Google Scholar]
- Smith, M. D., Khanzadyan, T., & Davis, C. J. 2003, MNRAS, 339, 524 [NASA ADS] [CrossRef] [Google Scholar]
- Soker, N. 1990, AJ, 99, 1869 [NASA ADS] [CrossRef] [Google Scholar]
- Speck, A. K., Meixner, M., Jacoby, G. H., & Knezek, P. M. 2003, PASP, 115, 170 [Google Scholar]
- Stasińska, G., & Szczerba, R. 2001, A&A, 379, 1024 [NASA ADS] [CrossRef] [EDP Sciences] [Google Scholar]
- Steffen, W., López, J. A., & Lim, A. 2001, ApJ, 556, 823 [NASA ADS] [CrossRef] [Google Scholar]
- Stock, D. J., Barlow, M. J., & Wesson, R. 2011, MNRAS, 418, 2532 [NASA ADS] [CrossRef] [Google Scholar]
- Storey, J. W. V. 1984, MNRAS, 206, 521 [NASA ADS] [Google Scholar]
- Tielens, A. G. G. M., & Hollenbach, D. 1985a, ApJ, 291, 722 [Google Scholar]
- Tielens, A. G. G. M., & Hollenbach, D. 1985b, ApJ, 291, 747 [NASA ADS] [CrossRef] [Google Scholar]
- Ueta, T., Ladjal, D., Exter, K. M., et al. 2014, A&A, 565, A36 [NASA ADS] [CrossRef] [EDP Sciences] [Google Scholar]
- van der Walt, S., Colbert, S. C., & Varoquaux, G. 2011, Comput. Sci. Eng., 13, 22 [Google Scholar]
- Virtanen, P., Gommers, R., Oliphant, T. E., et al. 2020, Nature Methods, 17, 261 [CrossRef] [Google Scholar]
- Walsh, J. R., Monreal-Ibero, A., Barlow, M. J., et al. 2016, A&A, 588, A106 [NASA ADS] [CrossRef] [EDP Sciences] [Google Scholar]
- Walsh, J. R., Monreal-Ibero, A., Barlow, M. J., et al. 2018, A&A, 620, A169 [NASA ADS] [CrossRef] [EDP Sciences] [Google Scholar]
- Weilbacher, P. M., Monreal-Ibero, A., Kollatschny, W., et al. 2015, A&A, 582, A114 [NASA ADS] [CrossRef] [EDP Sciences] [Google Scholar]
- Wesson, R., Cernicharo, J., Barlow, M. J., et al. 2010, A&A, 518, L144 [NASA ADS] [CrossRef] [EDP Sciences] [Google Scholar]
- Wesson, R., Matsuura, M., Zijlstra, A. A., et al. 2024, MNRAS, 528, 3392 [NASA ADS] [CrossRef] [Google Scholar]
- Williams, R., Jenkins, E. B., Baldwin, J. A., et al. 2008, ApJ, 677, 1100 [NASA ADS] [CrossRef] [Google Scholar]
Corresponding author; This email address is being protected from spambots. You need JavaScript enabled to view it.
We used the dataset of Corradi et al. instead of the science verification (SV) data (Walsh et al. 2016, 2018) because the latter were ~65% shallower. The larger seeing in the dataset of Corradi et al. (0.9-1.2 arcsec; see Table 2) relative to the SV dataset (0.5-0.6 arcsec) has little impact on the current study of the LISs (d ~ 3 arcsec) in NGC 7009. Spectroscopic analysis of NGC 7009 has shown that the two datasets agree well (Akras et al. 2022b).
These luminosities were estimated considering distances of 1.4 kpc Sabbadin et al. (2004) and 0.86 kpc Gonçalves et al. (2006). Considering the geometric distance of 1.18 kpc (1.13 and 1.26 kpc are the 16 and 84% percentiles) in the Gaia Early Data Release 3 (Bailer-Jones et al. 2021), we get log(L/L⊙) = 3.55 and 3.8, respectively.
All Tables
Planetary nebulae in which the [C I] λ8727 and/or λλ9824, 9850 emission lines have been detected.
All Figures
|
Fig. 1 [C I] λ8727 emission line in the MUSE map of NGC 7009 in 1 × 1 spatial binning. |
| In the text | |
|
Fig. 2 Illustration of the spatial distribution of the atomic carbon that reveals the clumpy structures superimposed on the extended emission of NGC 7009. Upper panel: [C I] λ8727 line MUSE flux map at a 5×5 spatial binning. Six different clumpy structures on the nebula are indicated as red crosses and labeled from k1 to k6 (Gonçalves et al. 2004a). The color bar corresponds to the intensity of the emission line. Bottom panels: observed spectra (solid blue lines) in the range from 8720 to 8740 Å extracted from the six distinct spaxels in units of 10−20 erg s−1 cm−1 Å−1. The three emission lines in this particular spectral range are [C I] at 8727.1 Å, [Fe III] at 8728.8 Å, and He i at 8733.4 Å, and they were fitted assuming a Gaussian profile (dashed orange lines). The vertical dashed green lines indicate the wavelengths in the rest frame. |
| In the text | |
|
Fig. 3 [C I] λ8727/He I λ8733 line ratio map from MUSE data of NGC 7009. |
| In the text | |
|
Fig. 4 Radial ionization stratification in the LISs of NGC 7009. Isocontours normalized to the maximum value of the emission lines at the position of knot k1, overlaid on the MUSE [N II] 16584 emission line map from Akras et al. (2022b). Upper left panel: Hα (red), Brγ (dashed red) and H2 (yellow) emission lines. Lower left panel: Brγ and H2 (dashed red and yellow; Akras et al. 2020a), [Fe II] (cyan; Akras et al. 2024), [O I], [S II] and [O III] (dashed green, magenta and blue, respectively; Akras et al. 2022b) and [C I] (green, this work). The field of view of the upper and lower panels is 7.5×6 arcsec and 6.5×4.8 arcsec, respectively. The arrow indicates the direction of the central star. North is up and east is to the left. |
| In the text | |
|
Fig. 5 Schematic representation of the emission line stratification in a photoevaporated (upper panel) and shock-heated due to the interaction with nebular gas or ISM (lower panel) clump. The dashed green arrows and green region represent the photoevaporative flow due to the illumination of the clump (blue region) by the UV stellar radiation field (black arrows) and the shock-heated gas by the reverse shock propagating into the clump as well as the shock-heated gas in case of an interaction with the surrounding medium due to the outward motion of the clump. The solid blue and green arrows at the bottom of each cartoon show the increase in the extinction Av, Te, and ne, respectively. uIF and uS F correspond to the velocity of the ionization and shock fronts, respectively. |
| In the text | |
Current usage metrics show cumulative count of Article Views (full-text article views including HTML views, PDF and ePub downloads, according to the available data) and Abstracts Views on Vision4Press platform.
Data correspond to usage on the plateform after 2015. The current usage metrics is available 48-96 hours after online publication and is updated daily on week days.
Initial download of the metrics may take a while.