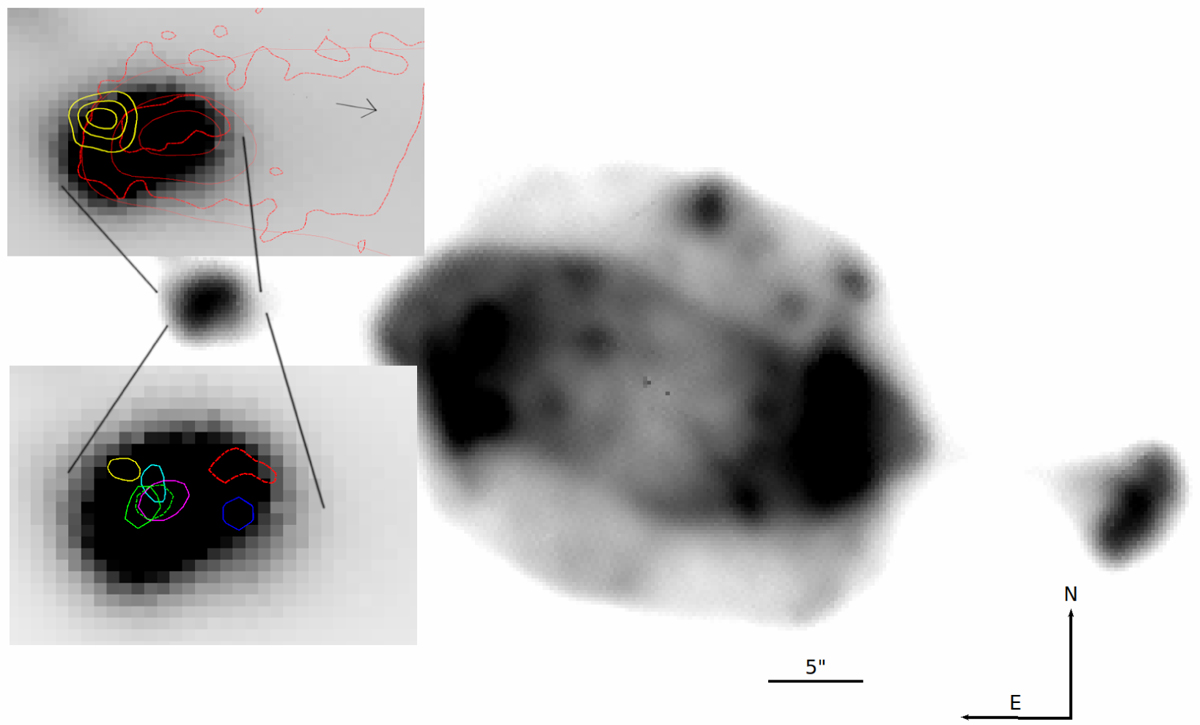
Fig. 4
Download original image
Radial ionization stratification in the LISs of NGC 7009. Isocontours normalized to the maximum value of the emission lines at the position of knot k1, overlaid on the MUSE [N II] 16584 emission line map from Akras et al. (2022b). Upper left panel: Hα (red), Brγ (dashed red) and H2 (yellow) emission lines. Lower left panel: Brγ and H2 (dashed red and yellow; Akras et al. 2020a), [Fe II] (cyan; Akras et al. 2024), [O I], [S II] and [O III] (dashed green, magenta and blue, respectively; Akras et al. 2022b) and [C I] (green, this work). The field of view of the upper and lower panels is 7.5×6 arcsec and 6.5×4.8 arcsec, respectively. The arrow indicates the direction of the central star. North is up and east is to the left.
Current usage metrics show cumulative count of Article Views (full-text article views including HTML views, PDF and ePub downloads, according to the available data) and Abstracts Views on Vision4Press platform.
Data correspond to usage on the plateform after 2015. The current usage metrics is available 48-96 hours after online publication and is updated daily on week days.
Initial download of the metrics may take a while.