Fig. 5
Download original image
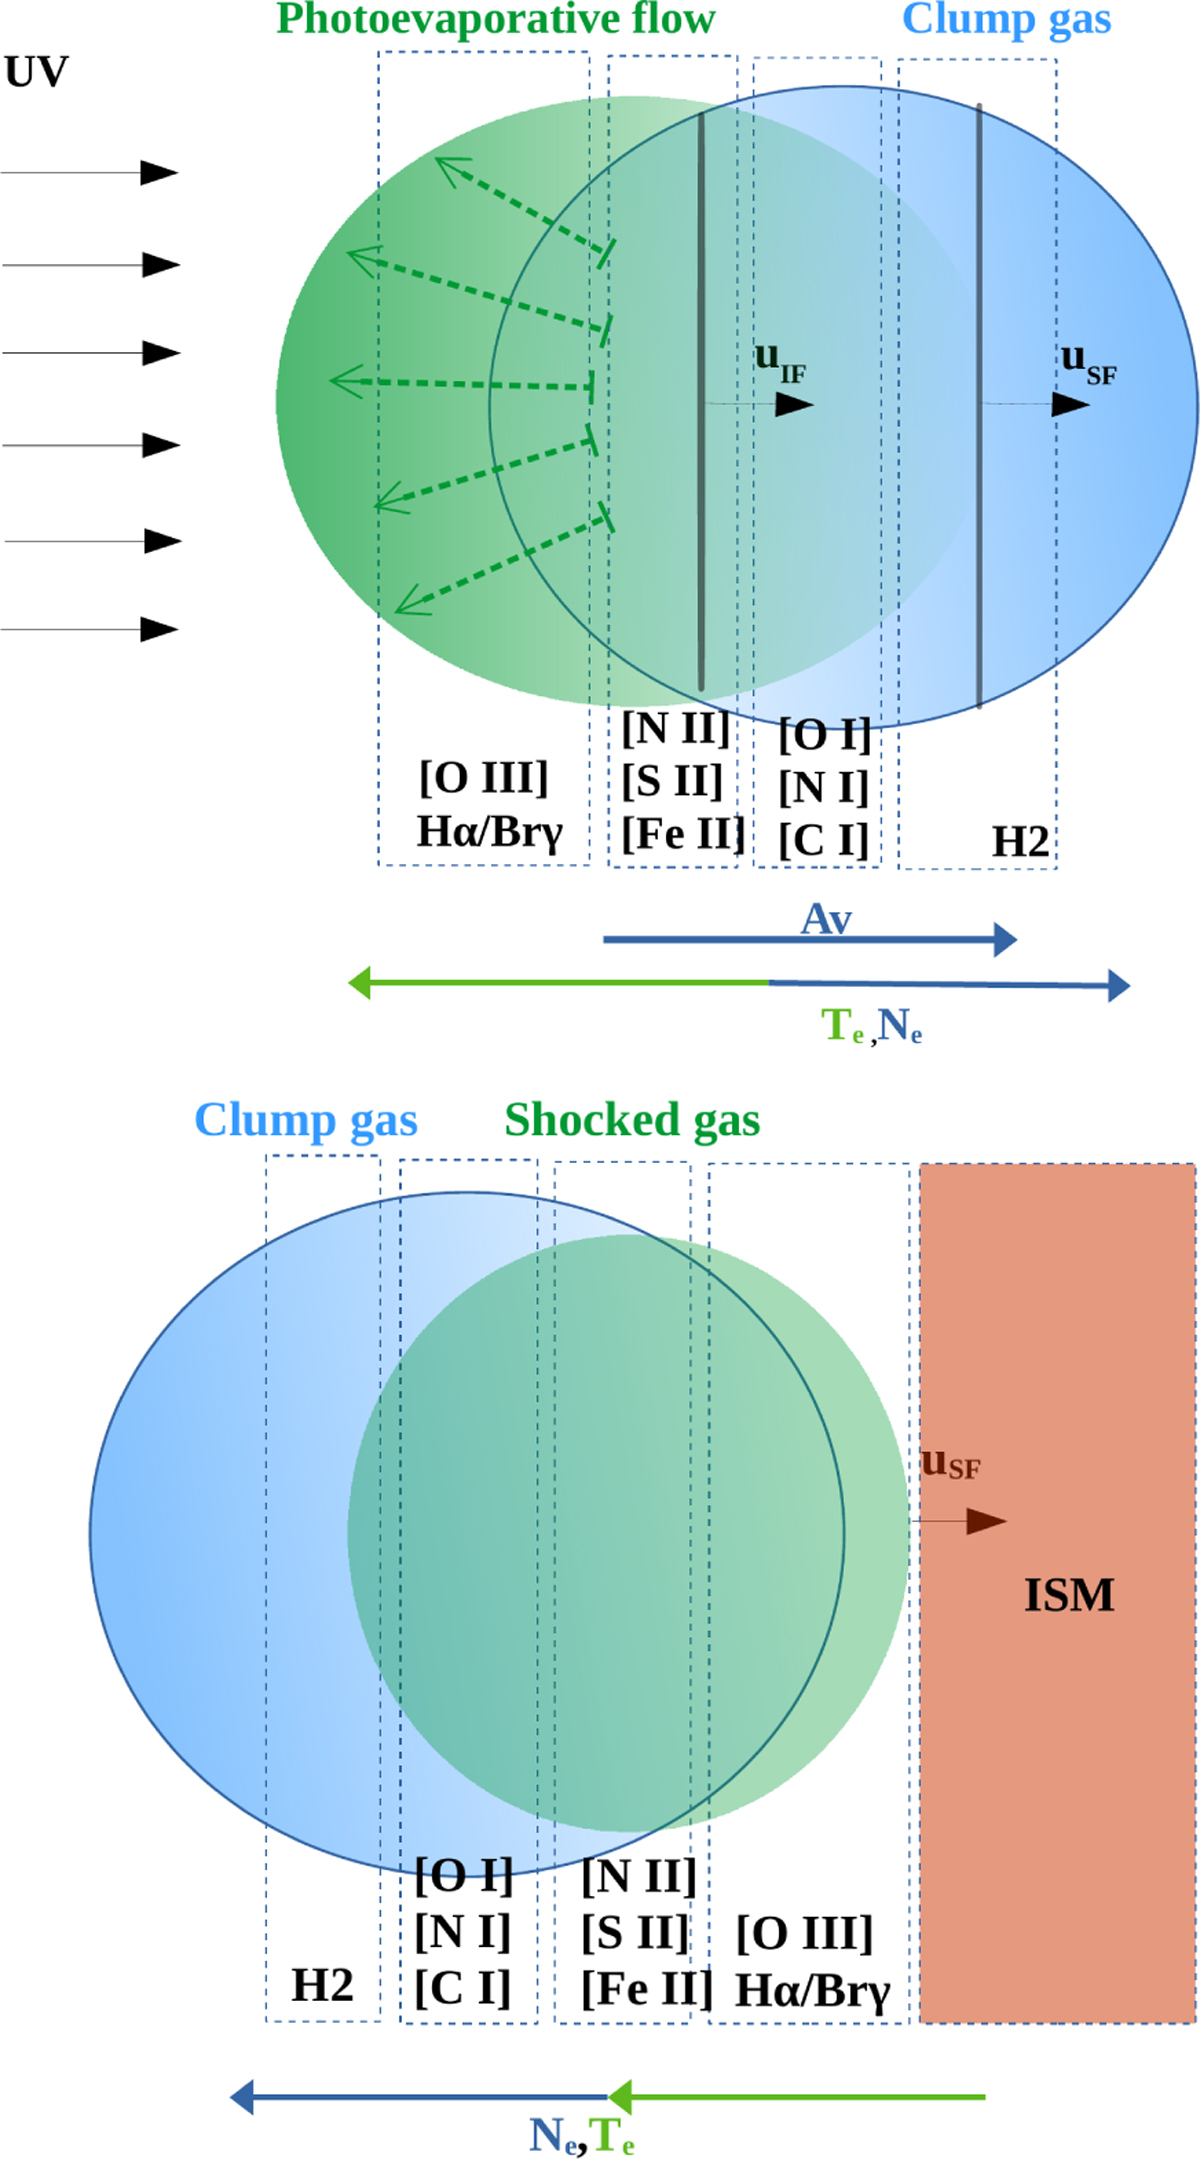
Schematic representation of the emission line stratification in a photoevaporated (upper panel) and shock-heated due to the interaction with nebular gas or ISM (lower panel) clump. The dashed green arrows and green region represent the photoevaporative flow due to the illumination of the clump (blue region) by the UV stellar radiation field (black arrows) and the shock-heated gas by the reverse shock propagating into the clump as well as the shock-heated gas in case of an interaction with the surrounding medium due to the outward motion of the clump. The solid blue and green arrows at the bottom of each cartoon show the increase in the extinction Av, Te, and ne, respectively. uIF and uS F correspond to the velocity of the ionization and shock fronts, respectively.
Current usage metrics show cumulative count of Article Views (full-text article views including HTML views, PDF and ePub downloads, according to the available data) and Abstracts Views on Vision4Press platform.
Data correspond to usage on the plateform after 2015. The current usage metrics is available 48-96 hours after online publication and is updated daily on week days.
Initial download of the metrics may take a while.