Fig. 2
Download original image
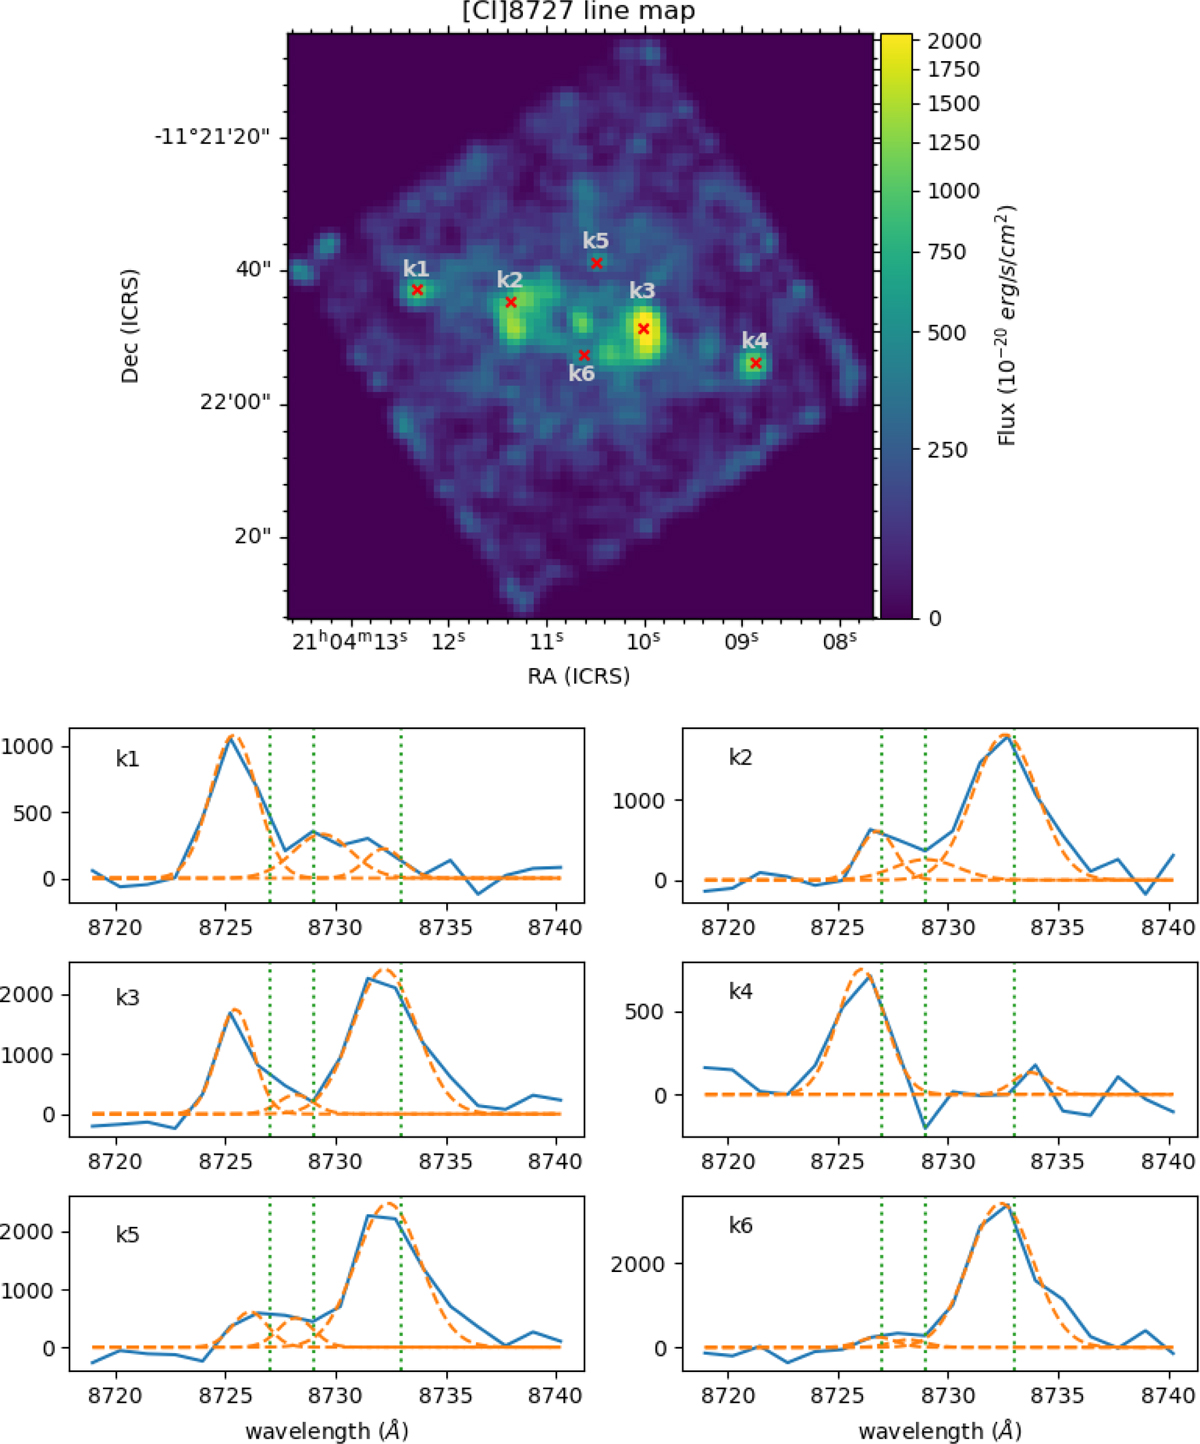
Illustration of the spatial distribution of the atomic carbon that reveals the clumpy structures superimposed on the extended emission of NGC 7009. Upper panel: [C I] λ8727 line MUSE flux map at a 5×5 spatial binning. Six different clumpy structures on the nebula are indicated as red crosses and labeled from k1 to k6 (Gonçalves et al. 2004a). The color bar corresponds to the intensity of the emission line. Bottom panels: observed spectra (solid blue lines) in the range from 8720 to 8740 Å extracted from the six distinct spaxels in units of 10−20 erg s−1 cm−1 Å−1. The three emission lines in this particular spectral range are [C I] at 8727.1 Å, [Fe III] at 8728.8 Å, and He i at 8733.4 Å, and they were fitted assuming a Gaussian profile (dashed orange lines). The vertical dashed green lines indicate the wavelengths in the rest frame.
Current usage metrics show cumulative count of Article Views (full-text article views including HTML views, PDF and ePub downloads, according to the available data) and Abstracts Views on Vision4Press platform.
Data correspond to usage on the plateform after 2015. The current usage metrics is available 48-96 hours after online publication and is updated daily on week days.
Initial download of the metrics may take a while.