Fig. 5.
Download original image
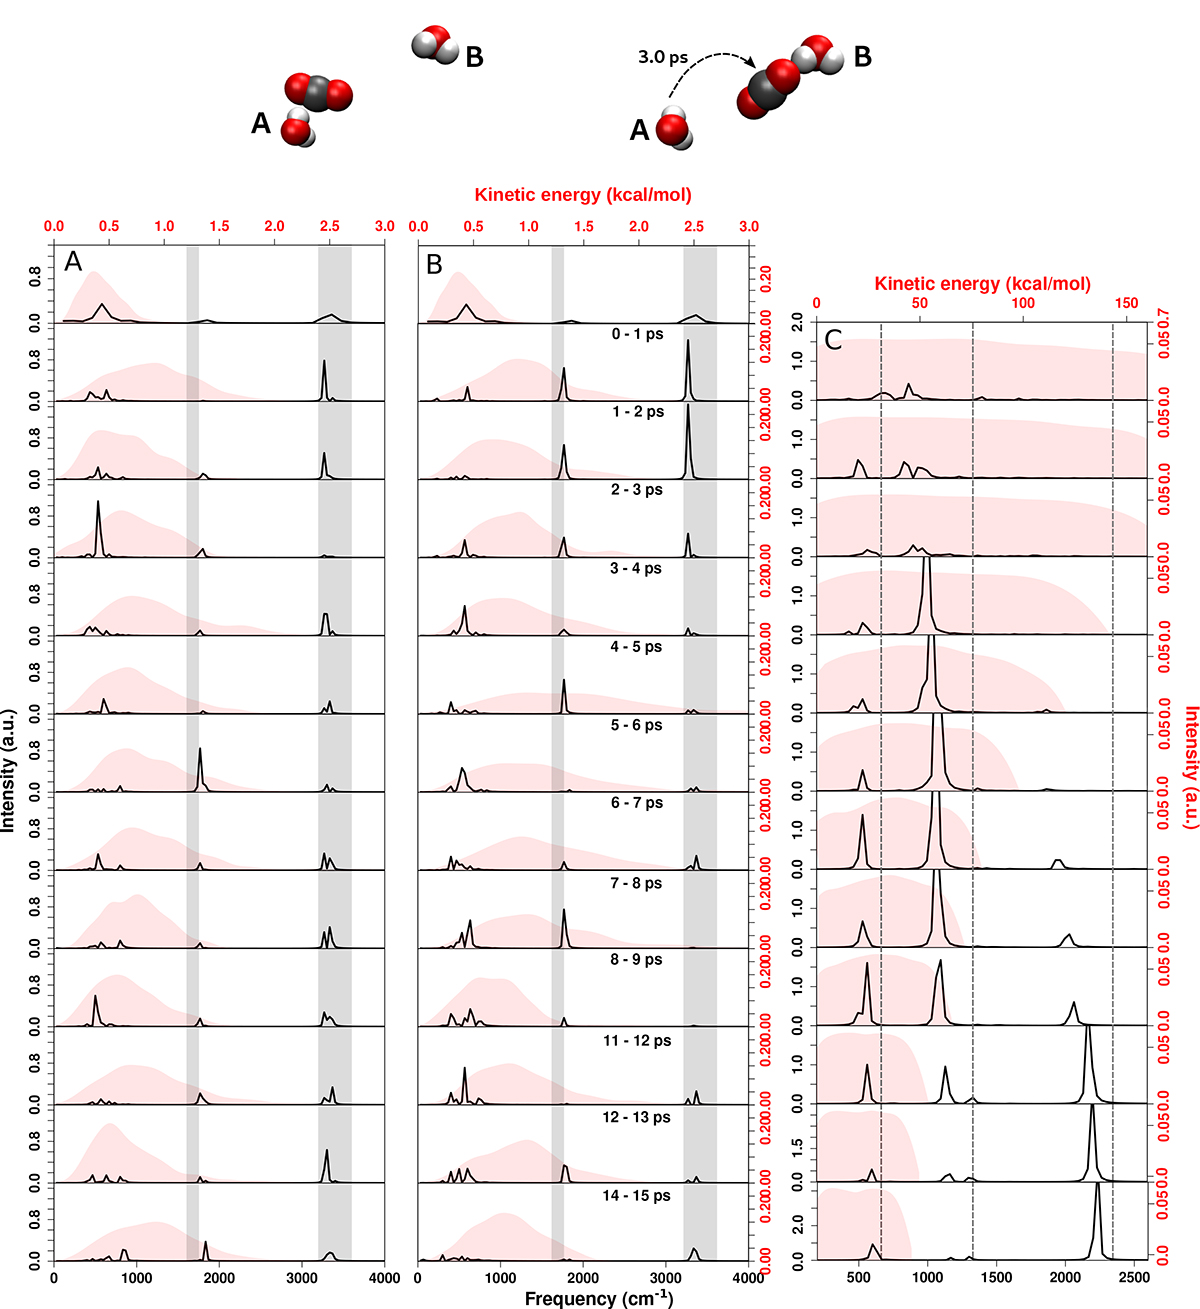
Vibrational density of states power spectrum (in black) and P(Ekin) (red) for water molecules A and B, WA (panel A) and WB (panel B), on the ASW surface at several delay times after the formation of CO2 on the RKHS-PES. The IR bands at 1600 − 1750 and 3200 − 3600 cm−1 correspond to bending and OH-stretching modes (Hagen & Tielens 1981; Yu et al. 2020; Devlin 1990). Panel C reports the kinetic energy distribution (red) and the vDOS of the CO2 molecule. Top panel: Averaged vDOS spectrum and kinetic energy distribution for ten water molecules away from the recombination site determined for the 0.5 ps prior to CO2 formation. Subsequent panels are labeled with the time interval after CO2 recombination. See Figure A.4 for an analysis of a trajectory using the MMH PES.
Current usage metrics show cumulative count of Article Views (full-text article views including HTML views, PDF and ePub downloads, according to the available data) and Abstracts Views on Vision4Press platform.
Data correspond to usage on the plateform after 2015. The current usage metrics is available 48-96 hours after online publication and is updated daily on week days.
Initial download of the metrics may take a while.