Open Access
Fig. A.11.
Download original image
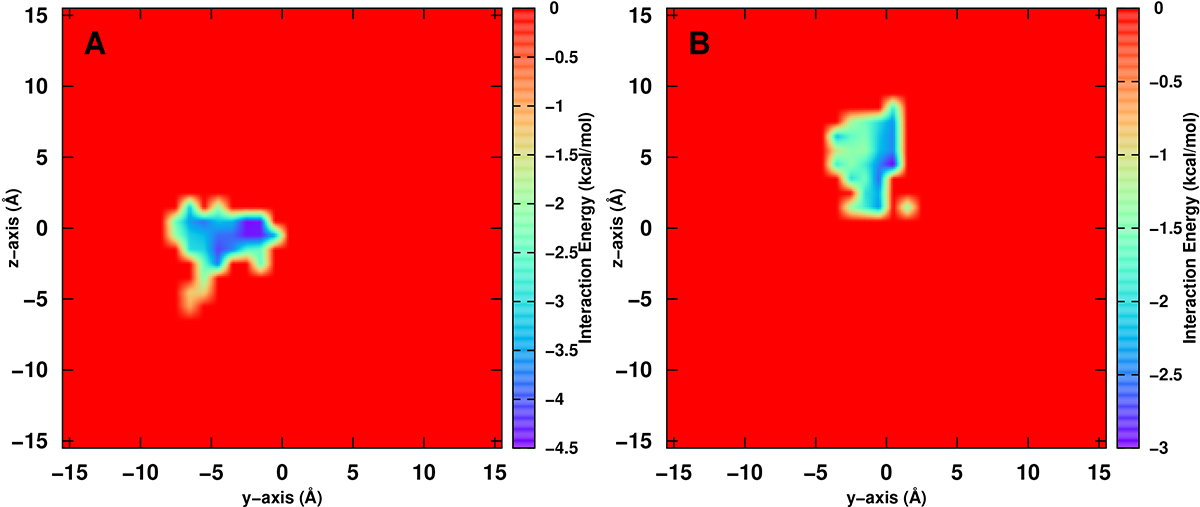
Diffusion of CO2 (Panel A) and NO2 (Panel B) on the water surface after recombination (XO+O → XO2) was observed in simulations running for 10 ns and 6 ns, respectively. This allows for comparison with the diffusion at 50 K, as shown in Figure A.10.
Current usage metrics show cumulative count of Article Views (full-text article views including HTML views, PDF and ePub downloads, according to the available data) and Abstracts Views on Vision4Press platform.
Data correspond to usage on the plateform after 2015. The current usage metrics is available 48-96 hours after online publication and is updated daily on week days.
Initial download of the metrics may take a while.