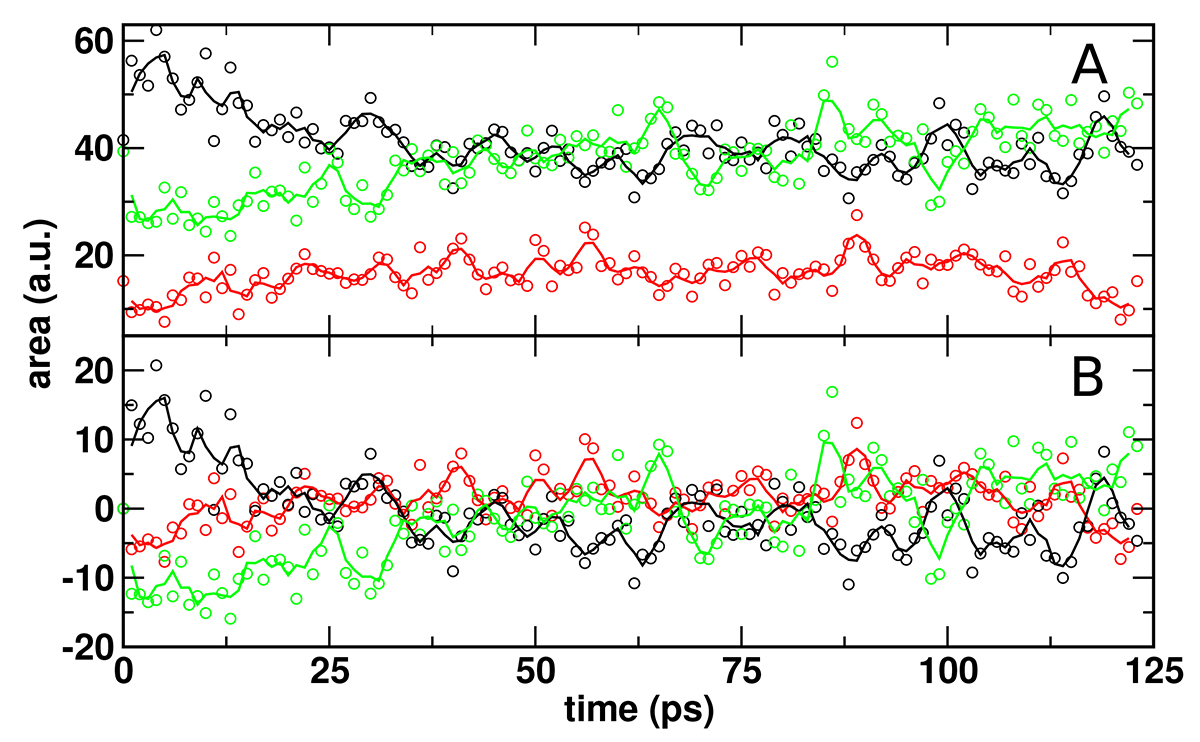
Fig. A.8.
Download original image
Time evolution of the integrated change of vDOS curves averaged over 100 water molecules for libration (black), bending (red), and stretching modes (green) of water using the MMH-PES. In Panel A, the equilibrium, thermally averaged area before recombination is the reference for calculating the difference at time t whereas for Panel B the peak area right after excitation (t = 1ps) is the reference. Here, solid lines represent the 4-point moving average.
Current usage metrics show cumulative count of Article Views (full-text article views including HTML views, PDF and ePub downloads, according to the available data) and Abstracts Views on Vision4Press platform.
Data correspond to usage on the plateform after 2015. The current usage metrics is available 48-96 hours after online publication and is updated daily on week days.
Initial download of the metrics may take a while.