Open Access
Fig. A.5.
Download original image
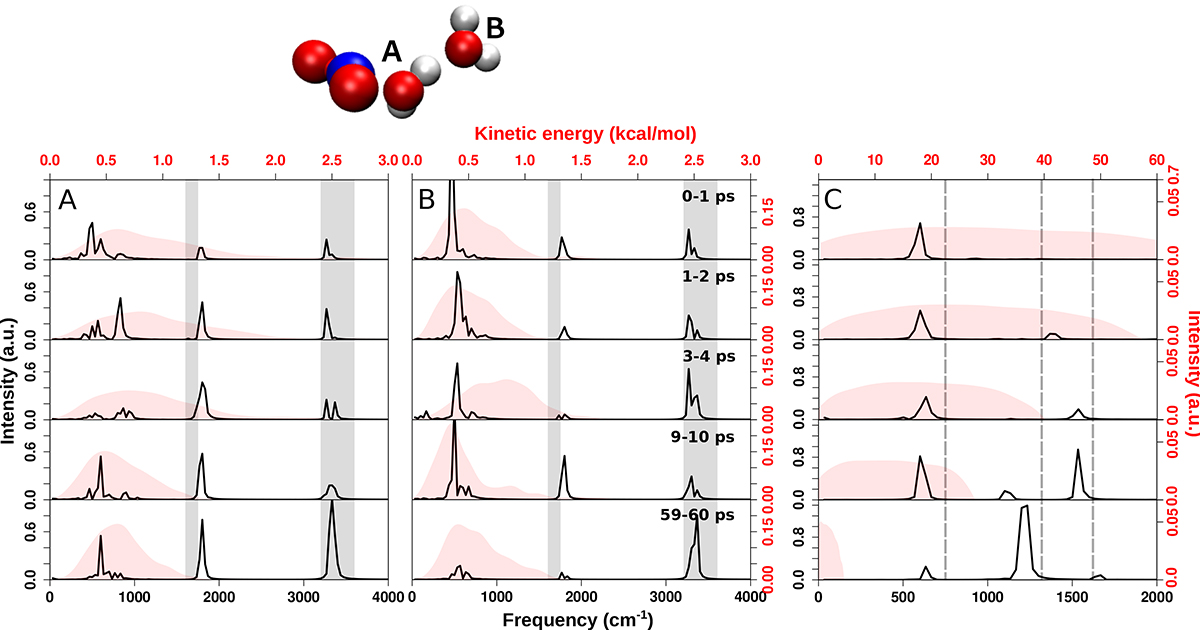
Vibrational density of states power spectrum (in black) and P(Ekin) (red) for water molecules A and B, WA (panel A) and WB (panel B), on the ASW surface at several delay times after the formation of NO2 using the MMH-PES. Panel C reports the kinetic energy distribution (red) and the vDOS of the NO2 molecule.
Current usage metrics show cumulative count of Article Views (full-text article views including HTML views, PDF and ePub downloads, according to the available data) and Abstracts Views on Vision4Press platform.
Data correspond to usage on the plateform after 2015. The current usage metrics is available 48-96 hours after online publication and is updated daily on week days.
Initial download of the metrics may take a while.