| Issue |
A&A
Volume 689, September 2024
|
|
|---|---|---|
| Article Number | A351 | |
| Number of page(s) | 10 | |
| Section | Stellar structure and evolution | |
| DOI | https://doi.org/10.1051/0004-6361/202449562 | |
| Published online | 25 September 2024 | |
The evolution of accreting population III stars at 10−6–103 M⊙ yr−1
1
Geneva Observatory, Geneva University, 1290 Versoix, Switzerland
2
Niels Bohr International Academy, Niels Bohr Institute, Blegdamsvej 17, 2100 Copenhagen, Denmark
3
Institute of Cosmology and Gravitation, University of Portsmouth, Portsmouth PO1 3FX, UK
4
Institut fuer Astrophysik, Universität Zurich, Winterthurerstrasse 190, 805 Zurich, Switzerland
Received:
9
February
2024
Accepted:
16
July
2024
Abstract
Context. The first stars formed over five orders of magnitude in mass by accretion in primordial dark matter halos.
Aims. We study the evolution of massive, very massive and supermassive primordial (Pop III) stars over nine orders of magnitude in accretion rate.
Methods. We use the stellar evolution code GENEC to evolve accreting Pop III stars from 10−6–103 M⊙ yr−1 and study how these rates determine final masses. The stars are evolved until either the end central Si burning or they encounter the general relativistic instability (GRI). We also examine how metallicity affects the evolution of the star at one accretion rate.
Results. At rates below ∼2.5 × 10⁻⁵ M⊙ yr−1 the final mass of the star falls below that required for pair-instability supernovae. The minimum rate required to produce black holes with masses above 250 M⊙ is ∼5 × 10⁻⁵ M⊙ yr−1, well within the range of infall rates found in numerical simulations of halos that cool via H2, ≲10−3 M⊙ yr−1. At rates of 5 × 10⁻⁵ M⊙ yr−1 to 4 × 10⁻² M⊙ yr−1, like those expected for halos cooling by both H2 and Lyα, the star collapses after Si burning. At higher accretion rates the GRI triggers the collapse of the star during central H burning. Stars that grow at above these rates are cool red hypergiants with effective temperatures log(Teff) = 3.8 and luminosities that can reach 1010.5 L⊙. At accretion rates of 100–1000 M⊙ yr−1 the gas encounters the general relativistic instability prior to the onset of central hydrogen burning and collapses to a black hole with a mass of ∼106 M⊙ without ever having become a star.
Conclusions. Our models corroborate previous studies of Pop III stellar evolution with and without hydrodynamics over separate, smaller ranges in accretion rate. They also reveal for the first time the critical transition rate in accretion above which catastrophic baryon collapse, like that which can occur during galaxy collisions in the high-redshift Universe, produces supermassive black holes via dark collapse.
Key words: accretion / accretion disks / stars: evolution / stars: massive / stars: Population III / stars: protostars
Corresponding author; This email address is being protected from spambots. You need JavaScript enabled to view it. .
© The Authors 2024
 Open Access article, published by EDP Sciences, under the terms of the Creative Commons Attribution License (https://creativecommons.org/licenses/by/4.0), which permits unrestricted use, distribution, and reproduction in any medium, provided the original work is properly cited.
This article is published in open access under the Subscribe to Open model. This email address is being protected from spambots. You need JavaScript enabled to view it. to support open access publication.
1. Introduction
Primordial (or Pop III) star formation is thought to begin at z ∼ 20–25 when cosmological halos reach masses of ≳105 M⊙ and cool by H2 forming in the gas phase (Stahler et al. 1986; Bromm et al. 1999; Nakamura & Umemura 2001; Abel et al. 2002 – see also Greif 2015; Klessen & Glover 2023). Although the Pop III initial mass function (IMF) has not been observationally constrained, cosmological simulations suggest that H2 cooling produces primordial stars with masses of a few tens to hundreds of solar masses (e.g., Hosokawa et al. 2011; Hirano et al. 2014, 2015; Latif et al. 2022a). These stars are thought to form in small clusters and grow by accretion at rates of up to 10−3 M⊙ yr−1, which can become clumpy if the accretion disk fragments (Clark et al. 2011; Greif et al. 2011; Sakurai et al. 2015).
At slightly later times, the buildup of infrared and Lyman-Werner UV backgrounds by Pop III stars can suppress star formation in other primordial halos through direct photodissociation of H2 and photodetachment of H−, the primary channel through which H2 forms in the gas phase (e.g., Sugimura et al. 2014; Agarwal & Khochfar 2015; Latif et al. 2015). The halos grow to larger masses through mergers and accretion until they reach virial temperatures of 104 K at masses of 107 M⊙ that activate Lyα cooling that triggers catastrophic baryon collapse with infall rates of up to 1 M⊙ yr−1. In reality, even at these masses and temperatures some H2 survives in the core of the halo by self shielding (Prole et al. 2024), so accretion rates at the very center of the halo are mediated by both Lyα and H2 cooling at somewhat lower rates of 0.01–1 M⊙ yr−1. Whether or not this infall eventually produces a single supermassive object or small numbers of massive objects remains unclear because of the short times for which these systems have been evolved to date (Regan & Downes 2018; Suazo et al. 2019; Regan et al. 2020), but recent simulations at lower resolution on timescales of SMS growth and collapse make clear that these halos will host multiple very massive or supermassive stars (SMSs; Patrick et al. 2023).
Such accretion rates are thought to produce SMSs with masses of a few 104–105 M⊙ (Omukai & Palla 2001, 2003; Hosokawa et al. 2013; Umeda et al. 2016; Woods et al. 2017; Haemmerlé et al. 2018b; Herrington et al. 2023). Those that accrete at rates above ∼0.02 M⊙ yr−1 evolve along cool, red, superluminous Hayashi tracks due to H− opacity in their outer layers, and those that grow at below this rate migrate to hot, blue compact supergiant tracks (Herrington et al. 2023; Nandal et al. 2023). Herrington et al. (2023) also found this accretion rate to be the lower limit at which the SMS encountered the GRI and collapsed to a BH. Below it, SMSs collapse because of depletion of core fuel in post main-sequence burning. It is now thought that collapse can cause some SMSs to explode as highly energetic supernovae (SNe) with energies of up to 1055 erg instead of forming BHs (Chen et al. 2014a; Nagele et al. 2022). Runaway stellar collisions in dense nuclear clusters at high redshifts can also build up 1000–3000 M⊙ stars (Begelman & Rees 1978; Devecchi & Volonteri 2009; Katz et al. 2015; Sakurai et al. 2017; Reinoso et al. 2018; Boekholt et al. 2018). Collsions between early galaxies can even gravitationally torque gas at solar metallicities into supermassive nuclear disks (SNDs) that may be prone to radial GR instabilities and collapse at rates of up to 105 M⊙ yr−1 (Mayer et al. 2010; Mayer & Bonoli 2019; Zwick et al. 2023), calling into question if stars can even form at such accretion rates (Haemmerlé 2020; Haemmerlé et al. 2021). SMSs are currently the leading contenders for the origin of the first quasars at z > 6 (e.g., Di Matteo et al. 2012; Smidt et al. 2018; Latif et al. 2022b) and less massive BHs found at z = 10.1 and 10.6 in the James Webb Space Telescope (JWST) JADES and CEERS surveys (UHZ1 and GN-z11; Bogdán et al. 2023; Maiolino et al. 2023).
No single study has ever considered the entire range of accretion rates relevant to Pop III star evolution, from those mediated by H2 cooling at low temperatures (Murphy et al. 2021) to those associated with the merger scenario of SMBH formation, in which the GRI might envelop the protostar prior to main sequence burning. Here, we extend previous studies to model Pop III star evolution over nine decades in accretion rate, from 10−6–103 M⊙ yr−1, in 1 dex steps with the Geneva Stellar Evolution Code (GENEC). For clarity, throughout this paper, we refer to protostars as accreting objects powered primarily by contraction, and stars as those mainly driven by nuclear reactions. In Section 2, we describe our GENEC models. We present Hertzsprung-Russell diagrams for our protostars and stars in Section 3 and their properties as a function of accretion rate in Section 4. The final masses of the accreting objects are discussed in Section 5 and the impact of changing metallicity is covered in Section 6. Future studies are considered in Section 7.
2. Models
We assumed that accretion proceeds at constant rates. Other studies have begun to examine SMS evolution in the cosmological flows that create them (Woods et al. 2021, 2024 – see also Sakurai et al. 2015, 2016). However, they generally find outcomes similar to those for stars that evolve at the equivalent average rate and it would not have been possible to systematically investigate the large range in accretion rate we consider here with such models. We also assumed that accretion proceeds at the same rate regardless of if the star evolves onto a hot, blue track and becomes a significant source of ionizing UV flux that could photoheat infalling gas and reduce its flow rate. This is not a serious limitation, as recent cosmological simulations of Direct Collapse Black Hole (DCBH) formation that include radiation from the progenitor find that its UV flux at most reduces accretion rates by 50% so they can grow at the rates we consider here (e.g., Latif et al. 2021). We also assumed ‘cold’ accretion in which the accretion luminosity is assumed to be radiated away, with no transport of entropy into the interior of the star. Hosokawa et al. (2013) considered both extremes, in which the accretion luminosity was also taken up into the star, and found only minor differences in evolution over early ranges in mass that disappeared above a few thousand solar masses.
Our stars are evolved from the pre-main sequence (pre-MS) phase to the end of core silicon burning (with the exception of 10−2 M⊙ yr−1 model which is evolved until the later stage of core helium burning, Yc = 0.4) with GENEC (Eggenberger et al. 2008). They have initial homogeneous chemical compositions of X = 0.7516, Y = 0.2484, and metallicities Z= 0, consistent with Murphy et al. (2021). The 0.1 M⊙ yr−1 models at Z = 10−6 and Z⊙ have the same chemical composition used in Nandal et al. (2024). All models began their evolution as fully convective hydrostatic seeds with different initial masses; models with accretion rates from 10−6 M⊙ yr−1 to 0.1 M⊙ yr−1 start as 2 M⊙ seeds and models with accretion rates beyond 0.1 M⊙ yr−1 start as 10 M⊙ seeds. The choice of different initial seed masses is to facilitate numerical converge during the early preMS phase (first 50 years) and such a choice does not affect the evolution and final fates of models. We also included deuterium with a mass fraction X2 = 5 × 10⁻⁵, as in Bernasconi & Maeder (1996), Behrend & Maeder (2001), Haemmerlé et al. (2018b). The equations of state, nuclear reaction rates, opacities and the same those used in Ekström et al. (2012) and Nandal et al. (2024). Numerical convergence poses significant challenges in models at high accretion rates. Particularly, models with accretion rates of 102 and 103 M⊙ per year encounter considerable difficulties. To secure the most accurate physical solutions, we systematically decreased the time steps between fully converged solutions, spanning several hours to days. Further reduction in time steps would necessitate a level of numerical precision that surpasses the capabilities of current computational machinery. Moreover, the models with the highest accretion rates incorporate approximately 400 shells, a number chosen to balance the trade-off between numerical stability and the fidelity of the physical representation. Despite these efforts, the spatial resolution of these models remains a potential area for enhancement and such models may exhibit sudden change in radius due to spurious numerical defects.The onset of GRI was determined using the criteria described in Saio et al. (2024) which corresponds to the linear adiabatic pulsational analysis based on the work by Chandrasekhar (1964). The instability is determined when the frequency of adiabatic pulsations is negative and the amplitude of pulsations grows in the interior of the star. The equations (2)–(6) in Nagele et al. (2022) describe the criteria governing the instability in detail. Once the accreting models are found to reach the GRI according to the criteria described in Nagele et al. (2022), the models are post processed in the linear adiabatic pulsational code (Saio et al. 2024) to determine the final mass. When a convective core is present, we used a step overshoot αov = 0.1. We do not include rotation in our models because they merit separate studies, and we also ignore mass loss due to line-driven winds. Previous studies have shown that mass loss is negligible at metallicities below 0.01 Z⊙ because H and He lines do not present enough opacity to outgoing photons (Kudritzki 2000; Vink et al. 2001; Baraffe et al. 2001). They would be present in our solar metallicity models but would be overcome by accretion at the rates we consider.
3. HR diagrams
We show evolution tracks for our stars from 10−6–103 M⊙ yr−1 in 1 dex increments in the HR diagram in Figure 1. They fall into two basic categories, hot compact blue stars at accretion rates below ∼0.02 M⊙ yr−1 and cool red hypergiants on the Hayashi track above these rates (Nandal et al. 2023; Herrington et al. 2023). Below 10−2 M⊙ yr−1, we observe several features. First, as previously found in models at solar metallicity, the higher the accretion rate the larger the mass MJ at which the track joins the Zero Age Main Sequence (ZAMS). For instance, Figure 1 shows that this mass is about 3.5 M⊙ at 10−6 M⊙ yr−1 and 60 M⊙ at 10−3 M⊙ yr−1. Second, core H burning mostly occurs in the blue region of the HR diagram. However, as with classical tracks of core H-burning models, the birthlines curve rightward. This phase extends over a broader range of effective temperatures as the accretion rate increases. Third, in our models the most luminous blue stars reach maximum luminosities of about 108 L⊙.
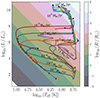 |
Fig. 1. HR diagram of massive and supermassive stars at zero metallicity at accretion rates of 10−6 M⊙ yr−1 to 103 M⊙ yr−1. The background colors indicate radii in units of solar radius. The blue line represents the Z = 0 ZAMS track with red dots marking masses in solar units. The tracks are labelled by accretion rate in black. The black dots indicate the end point of computation which corresponds to end of core Silicon burning for accretion rates up to 10−2 M⊙ yr−1 and the onset of GR instability for higher accretion rates. |
A rough estimate of MJ can be obtained by equating formation time (tform = M*/Ṁacc) with Kelvin-Helmholtz (KH) contraction time. The KH time can be found from the radius and luminosity of the star at the joining point so
 (1)
(1)
Here, the accretion rate is in M⊙ yr−1 and the effective temperature is in Kelvin. Table 1 lists the input values used to estimate MJ and the values derived from the numerical simulations. It is observed that for 10−3 M⊙ yr−1 there is a significant discrepancy between the analytic and numerical results1. Note that Equation 1 assumes that the pressure is dominated by an ideal gas when in reality radiation also contributes at higher masses. When radiation pressure is significant, a larger fraction of the energy released during contraction is used to increase the internal energy in order to maintain hydrostatic equilibrium. This gives a shorter Kelvin-Helmholtz timescale at a given mass. This implies that to accommodate a given formation timescale, a larger mass has to be considered. This explains the discrepancy in MJ between Equation (1) and our GENEC models.
Derived masses from different methods.
The evolution tracks of stars evolving along the Hayashi line before the onset of the core H burning transition from blue to red at luminosities that decrease as the accretion rate increases from 10−2–10−1 M⊙ yr−1. At higher accretion rates, the luminosity at the crossing towards the Hayashi line stabilizes at 105.7–106 L⊙. The tracks subsequently ascend the Hayashi line, reaching luminosities of up to 1010 L⊙. They evolve to bluer colors towards the end of core H burning. Finally, the stars can attain much larger luminosities, up to 1010.5 L⊙ at log(T) = 4.00–4.25.
4. Pop III SMS properties
4.1. Internal structures
We show Kippenhan diagrams of the structural evolution of the 10−2, 1 and 1000 M⊙ yr−1 models in Figure 2. Several interesting features emerge:
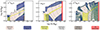 |
Fig. 2. Evolution of the total radius as a function of growing mass at accretion rates of 10−2 M⊙ yr−1 (left panel), 1 M⊙ yr−1 (centre panel) and 103 M⊙ yr−1 (right panel) shown in Kippenhahn diagrams. |
-
For all three models there is a point where the radius increases almost vertically on the diagram, indicating rapid expansion in short times. Rapid expansion prevents significant mass increase over those times and occurs at log(M/M⊙) ∼ 2.5, 1.5, and 1.5 at the three rates, respectively.
-
An outer convective zone develops, which diminishes in spatial extent as the accretion rate increases.
-
The isomass lines reveal that the majority of the star’s mass undergoes contraction.
-
At 1 M⊙ yr−1, as seen in the middle panel, there are two distinct phases with a convective core. The first phase coincides with core deuterium burning and the second phase is driven by hydrogen burning.
-
At 1000 M⊙ yr−1 the core is nearly fully convective after the first 100 years of evolution. Conditions are never met for core hydrogen burning.
4.2. Chemical structures
We show temperatures and elemental abundances for the 0.1 M⊙ yr−1 star at the end of its evolution in Figure 3, when it encounters the GRI at a central H mass fraction of 0.2. It has a surface region where the chemical composition is still primordial. The temperature at the bottom of the outer convective envelope is low enough to prevent the destruction of fragile species such as 2H, 3He and Li isotopes. At this point the star has a luminosity of 109.6 L⊙. In principle, if our models are accurate and surface abundances can be determined spectroscopically, some of these SMSs might retain surface abundances of light isotopes identical to those in primordial material. If the star loses its outer envelope at the time of collapse, this mass would have little if any 12C, 14N or 16O, just 1H and 4He. In contrast, Nandal et al. (2024) found that Pop III stars accreting at much lower rates, 10−4 − 10−3 M⊙ yr−1, that reach final masses of 1000–3000 M⊙, do not encounter the GRI but collapse after Si burning. As they transition to core He burning they become nearly fully convective, which leads to strong internal mixing and a surface enriched first by 4He and then 14N, 16O and 12C.
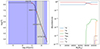 |
Fig. 3. The distribution of physical parameters and abundances of a 0.1 M⊙/yr model just before the end of evolution. Left panel: Log T versus log R plot for the 0.1 M⊙/yr model at the end of its evolution upon encountering GR instability at a mass of 108 000 M⊙. The blue zones indicate convective zones and grey zones correspond to radiative zones. The enclosed mass is indicated at different radii (see the numbers at red points). Most of the mass (105 000 M⊙) is within a radius of 1013 cm or 14.0 R⊙ that represents 1% of the total radius. Only a fraction of mass (still 23 000 M⊙) in the outer envelope implying the star is extremely bloated. Right panel: The plot depicts the change in abundance of various elements inside the 0.1 M⊙/yr model upon encountering the GR instability when central mass fraction of hydrogen is 0.244. |
4.3. Maximum luminosities
Figure 4 shows that the maximum luminosity reached by accreting blue stars is about 108 L⊙ at effective temperatures near 60 000 K (lgTeff ∼ 4.75). Red stars can exceed 1010.5 L⊙ at effective temperatures below 18 000 K (lgTeff < 4.25). As shown in the left panel of Figure 4, stars at the extremes of blue and red in the HR diagram have significantly different structures. Consider the 10−3 M⊙ yr−1 star at a mass of 2072 M⊙ at lgTeff = 4.83, which is undergoing core H burning. Its central H mass fraction is 0.30 with the convective core covering about 70% of the total mass. The 1 M⊙ yr−1 star at the same luminosity and similar mass, 2337 M⊙, is in the HR diagram’s redder region and has not started hydrogen burning, so its luminosity is primarily powered by contraction. Unlike the 10−3 M⊙ yr−1 star, the ratio Lr/Ltot in the 1 M⊙ yr−1 star is nearly linear with enclosed mass fraction (right panel of Figure 4). Over enclosed mass fractions of 0.1–0.5, the isotope 3He is formed but becomes depleted in the core. This star has an outer convective envelope that is about 10% of its total mass, most of the star is radiative as shown in the center panel of Figure 2.
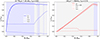 |
Fig. 4. Variation of luminosity (in mass fraction) as a function of mass coordinate inside two accreting models compared at same total luminosity. Left: total (solid), nuclear (dotted) and gravitational (dashed) luminosities versus enclosed mass fraction for the 10−3 M⊙ yr−1 star at a mass of 2072 M⊙ and total luminosity of 6.9 × 10⁷ L⊙. Right: Same as on the left but for a pre-MS 1.0 M⊙ yr−1 star at a mass of 2337 M⊙ and same total luminosity (in this case powered only by gravitational contraction). The dot-dashed lines show mass fractions for H (left) and 3He (right) in the star. The shaded blue and grey zones depict the convective and radiative regions respectively. |
5. Final stellar masses
Final masses and fates for the stars are shown versus accretion rate in Figure 5 (compare to Figure 2 of, Heger & Woosley 2002). Although we do not follow collapse in GENEC it is caused by the depletion of core fuel and formation of an iron core, the onset of pair-creation by thermal photons in the core at the expense of pressure support there, or the GRI, in which thermal photons contribute to gravity in the core via the stress-energy tensor and trigger violent pulsations that produce collapse. We list which process ends the life of the stars, and at what stage of evolution, in Table 2.
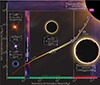 |
Fig. 5. Final mass versus accretion rate for 10−6 M⊙ yr−1 to 103 M⊙ yr−1. The gold line is for zero metallicity models, the silver line is for Z = 10−6 Z⊙ and the single dot at 1 M⊙ yr−1 is the solar metallicity model. The green bar marks the final mass range for which collapse occurs after core Si burning and the red bar is the mass range for which the GRI triggers collapse during central H burning. The vertical pair instability strip spans 150–250 M⊙ and is for the non accreting models while 7–150 M⊙ progenitors produce neutron stars or stellar-mass BHs. The oval shapes with numbers correspond to the central mass fraction of hydrogen at the time GRI is triggered. |
Final properties of the stars in this study.
5.1. Nuclear limit
The nuclear mass limit is reached when the formation timescale of the accreting star becomes equal to its total nuclear lifetime, when post-MS burning creates an iron core. At our lowest accretion rate the star reaches a mass of about 30 M⊙, well above that required for an iron core to form, so its final mass is determined by the nuclear limit. At higher accretion rates the star can reach greater masses before encountering the nuclear limit but at some point it will encounter an instability that causes it to collapse before an iron core can form. At these rates other limits impose a final mass on the star as explained below.
5.2. Pair instability limit
Massive stars encounter the pair instability (PI;, Rakavy & Shaviv 1967; Barkat et al. 1967) when temperatures in their cores exceed 109 K and thermal photons have enough energy to freeze out as electron – positron pairs, usually during central O or Si burning. The dip in pressure support due to the loss of these photons causes the core to contract, which can trigger explosive thermonuclear burning of O and Si. For non-accreting 140–260 M⊙ Pop III stars the energy released can completely unbind the star, with no compact remnant left behind (Heger & Woosley 2002; Whalen et al. 2013a,b). At 100–140 M⊙ the PI produces consecutive pulses that eject large masses from the star but do not fully disrupt it, producing bright transients and leaving behind an iron core that later collapses to a BH (the pulsational pair-instability, or PPI; Whalen et al. 2014; Chen et al. 2014b; Woosley et al. 2007; Woosley 2017; Leung et al. 2019. Rotation can build up more massive He cores at lower total masses, enabling such stars to encounter the PI at 85 M⊙ (Chatzopoulos & Wheeler 2012; Smidt et al. 2015; Chatzopoulos et al. 2015). At masses above 260 M⊙, non-accreting Pop III stars encounter the photodisintegration instability, in which thermal photons in the core preferentially crack He nuclei apart instead of creating positron-electron pairs (Heger & Woosley 2002). This process results in the prompt collapse of the core to a BH.
While 85–260 M⊙ stars can be built up by accretion rates of 2 × 10⁻⁵ M⊙ yr−1–8 × 10⁻⁵ M⊙ yr−1 in our models, it is not clear how accretion would affect the onset of the PI, and we cannot answer this question here because GENEC lacks the ability to switch to hydrodynamics to capture the explosion. Likewise, we cannot properly model the PPI because GENEC cannot reproduce the mass ejections that would disrupt accretion onto the star or therefore evolve the star in a self-consistent manner. Nevertheless, the mass limits for the PI and PPI for non-accreting Pop III stars are useful and reasonable approximations to the PI mass limit for accreting stars.
5.3. GRI limit
At accretion rates above a few 10−2 M⊙ yr−1 the star encounters the GRI, typically during central H burning. We find the minimum accretion rate required to trigger the GRI to be 0.05 M⊙ yr−1, when the star is at the onset of core He burning at a mass of 80 206 M⊙. Higher rates produce the GRI at earlier times in the MS. In Figure 5, we show the central hydrogen mass fraction at points where GRI occurs. At accretion rates beyond 100 M⊙ yr−1, the GRI happens before core H burning begins, leading to the birth of a dark collapse black hole (Mayer & Bonoli 2019).
We list final SMS masses due to collapse via the GRI in previous studies in Table 3 for several accretion rates. They can vary for several reasons. First, codes can linearize the Tolman-Oppenheimer-Volkoff (TOV) equation in a number of ways that can cause differences in mass at which the GRI triggers pulsations in the stars (in codes with hydrodynamics) or at which the stars satisfy semianalytical criteria for collapse (in codes without hydrodynamics). Second, criteria for collapse by the GRI in the absence of hydrodynamics vary by code. Finally, violent pulsations triggered by the GRI in codes with hydrodynamics usually cause the collapse of the star at lower masses than those at which criteria for collapse are met in codes without hydrodynamics. For example, we obtain a higher minimum accretion rate at which SMSs encounter the GRI than Herrington et al. (2023), who found it to be ∼0.02 M⊙ yr−1 because their code (MESA; Paxton et al. 2011, 2013, 2018) transitions to hydrodynamics at the onset of pulsations. Nevertheless, as shown in Table 3, our final masses are generally within 50% agreement with those in previous studies and differ by at most less than a factor of two.
Comparison of final masses at the onset of the GRI in units of 105 M⊙.
5.4. Analytical fits to final masses
The final stellar masses in Figure 5 can be fit by linear regressions in log accretion rate, Ṁ, applied separately to the two ranges in rate separated by 0.05 M⊙ yr−1, above which the star collapses via the GRI and below which the star runs up against the nuclear or PI mass limits:
 (2)
(2)
Here, Ṁ is in M⊙ yr−1. This relationship, which is based on our GENEC stellar evolution models, provides an approximation of a star’s maximum mass and is consistent with the nuclear, PI, and GR mass limits.
6. Metallicity
6.1. Low accretion rates
The left panel of Figure 6 shows birthlines for accreting stars at solar and primordial compositions. The primordial birthline is based on accretion rates from a hydrodynamical simulation by Yoshida et al. (2006). For solar metallicity, we used a constant accretion rate of 10−5 M⊙ yr−1. Comparison of these two birthlines offers insights into stellar evolution in primordial haloes versus the solar neighborhood. During the initial evolution phase before contracting to the ZAMS, the track for the accreting Pop III protostar shifts to lower effective temperatures than those with solar metallicity. This shift is primarily due to the accretion rate rather than metallicity. This is evident in the right panel of Figure 6, where birthlines for Pop III and solar metallicity stars with constant accretion rates of 10−3 M⊙ yr−1 are shown. Both tracks align up to a luminosity of 4.3 in units of log (L/L⊙), suggesting that metallicity has minimal impact. In the left panel of Figure 6, the birthline with solar metallicity and a lower accretion rate reaches the ZAMS at about 7 M⊙. In contrast, the Pop III star at the higher accretion rate reaches the ZAMS at a much higher mass, around 120 M⊙. This difference is due to accretion rate, a phenomenon previously discussed by Haemmerlé et al. (2016), because a higher accretion rates lead to larger masses within a KH time.
 |
Fig. 6. Birthlines for a few accretion rates and metallicities. Left: the dashed red line is for the variable accretion rate from a hydrodynamical simulation of a Pop III star by Yoshida et al. (2006). The solid black track is the 10−5 M⊙ yr−1 solar metallicity model. The short dashed green track is the 10−5 M⊙ yr−1 zero-metallicity model. The black circles and triangles mark the beginning and end of core hydrogen burning, respectively. Masses at the end of hydrogen burning are shown at the end of each track. The solid blue and yellow numbered dots and their masses (in M⊙) are non-accreting ZAMS stars at zero and solar metallicity from Murphy et al. (2021) and Ekström et al. (2012), respectively. The grey dotted lines are iso-radii for the indicated radii. Right: birthlines for Pop III (black) and solar metallicity (red) stars with a constant accretion rate of 10−3 M⊙ yr−1. The solid black and red numbered dots and their masses (in M⊙) are again the stars at zero and solar metallicity from Murphy et al. (2021) and Ekström et al. (2012), respectively, for comparison. |
The right panel of Figure 6 shows that the mass at which the birthline reaches the ZAMS is influenced by metallicity. For a given accretion rate, MJ ∼ 32 M⊙ at solar metallicity compared to 60 M⊙ at Z = 0. This difference is due to Z = 0 stars being more compact because of lower opacities and the absence of CNO elements, which are crucial for catalyzing hydrogen burning in the core. Their smaller radii at a given mass and luminosity lead to longer KH timescales and thus more time to accumulate mass. The birthlines for the Z = 0 and solar metallicity stars at the same accretion rate in the left panel of Figure 6 are quite similar, suggesting that accretion rate plays a more significant role than initial metallicity. Notably, the tracks overlap in the less luminous and redder regions of the HR diagram. Differences begin to appear as the star contracts towards blue regions. Furthermore, both birthlines reach the ZAMS at almost the same mass, with the Pop III star being slightly more massive. Their masses at the end of the MS are also similar. The mass at the end of the MS varies significantly with accretion rate. At lower accretion rates, the final mass is around 83 M⊙ while it exceeds 900 M⊙ at higher ones.
6.2. High accretion rates
Figure 7 shows evolutionary tracks for stars at various metallicities at an accretion rate of 1 M⊙ yr−1. Overall, the differences in tracks are relatively minor. At luminosities above 106 L⊙, during core H burning, the tracks shift toward the red at higher metallicities. This shift occurs because at higher metallicities the internal opacity of the star is larger and expands the star’s outer layers, causing cooler temperatures at optical depths of about 2/3. This effect changes the star’s radius and effective temperature but not its luminosity. At luminosities below 106 L⊙, the tracks shift towards the blue with increasing metallicity. This shift arises because at initial stages of accretion the higher opacities affects more of the star’s total mass, not just its outer layers, which in turn reduces the luminosity for a given mass. Therefore, as metallicity increases, the tracks are not only shifted to the right but also towards lower luminosities.
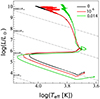 |
Fig. 7. HR diagram of 1 M⊙ yr−1 SMS models at three metallicities of Z = 0 (black line), Z = 10−6 (red) and Z = solar (green). |
Figure 8 shows some properties of the same stars at the end of their evolution. Comparison of the plots shows several interesting points:
-
The energy released per unit time and mass due to contraction is nearly constant through the interior at all metallicities, averaging around 105 ergs g−1 s−1.
-
The final mass is higher for greater metallicities. Consequently, the lifetimes vary with metallicity, being almost twice as long at solar metallicity as at zero metallicity.
-
Stars have larger radii at higher metallicities. The solar metallicity SMS has more than twice the radius of the Pop III SMS.
-
There is a notable bump in nuclear energy production rate at a mass fraction of 0.6 that is more pronounced in the Pop III SMS than in the solar metallicity star.
-
Central temperatures are higher in the Pop III model, which is a direct result of the absence of CNO elements.
Even during core H burning, these stars primarily generate energy through contraction. The longer lifetime of the solar metallicity SMS stems from its larger convective core, which prolongs core H burning and provides more time for accretion. The larger radius is a result of higher opacities in the outer layers.
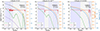 |
Fig. 8. Densities, temperatures and energy generation rates as functions of enclosed mass and radius for 1 M⊙ yr−1 stars at zero (left), 10−6 (centre) and solar (right) metallicities. The light blue and light grey regions indicate the convective and radiative zones respectively. |
7. Conclusion
We have explored the evolution of Pop III stars accreting at rates of 10−6–103 M⊙ yr−1. We find that
-
Stellar evolutionary tracks can broadly categorized by accretion rate, with a critical rate of approximately 0.025 M⊙ yr−1 below which stars migrate towards blue tracks and above which follow the Hayashi line prior to core H burning. This result is consistent with Herrington et al. (2023) and Nandal et al. (2024).
-
Blue stars reach bolometric luminosities up to 108 L⊙ at high effective temperatures and red stars reach 1010.5 at lower temperatures.
-
Below 10−2 M⊙ yr−1, the mass at which tracks join the ZAMS increases with accretion rate. Core H burning occurs in the blue region of the HR diagram.
-
Above 0.05 M⊙ yr−1, corresponding to a final mass of 84 600 M⊙, stars collapse via the GRI during core H burning. At extreme accretion rates of 100–1000 M⊙ yr−1 the gas encounters the GRI prior to the onset of H burning and collapses to a BH without forming a star (dark collapse). The GRI thus imposes an upper limit on mass on stars of approximately 106 M⊙.
-
Metallicity significantly influences the birthlines of stars. The evolutionary tracks shift towards the blue at lower luminosities and towards the red at higher luminosities with increasing metallicity. For a constant accretion rate of 1 M⊙ yr−1, higher metallicity results in a larger total mass at the end of evolution, increased stellar radii, and enhanced nuclear energy production.
We found that Pop III stars accreting even at modest rates of 10−3–10−4 M⊙ yr−1, like those found in numerical simulations of primordial halos cooled by H2, can reach masses of 300–3000 M⊙. In reality, ionizing UV feedback from the star would almost certainly terminate its growth at well below these masses by photoevaporating its accretion disk (and even driving all the gas from the halo; Whalen et al. 2004; Kitayama et al. 2004). Nevertheless, stars could still reach such masses in the multiphase environments of more massive halos that cool by both H2 and Lyα, in which radiation from the star can reduce but not fully suppress accretion.
As noted earlier, because GENEC does not capture pulsations triggered by the GRI, our final SMS masses should be taken to be upper limits because previous studies have shown that such pulsations can lead to the collapse of the core at lower masses than those found here. This raises the greater point that pulsations due to other mechanisms could arise well before those due to the GRI but have not been found by studies to date because they arise on timescales that are much shorter than the nuclear burning timescales on which the stars are advanced. In principle, such pulsations could lead to other instabilities that collapse or explode the star at lower masses than those found here. They would also clearly improve their prospects for detection at high redshifts by periodically brightening the star and allowing it to be found in searches for transients (Nagele et al. 2023b). But they could also end the growth of the star, especially if mass ejections become comparable to lower accretion rates. We will investigate the existence of such pulsations in future work.
Our models exclude rotation and magnetic fields, which have been shown to be important to the evolution of massive stars. Although SMSs are expected to be slow rotators due to the Ω − Γ limit (Maeder & Meynet 2000), Haemmerlé et al. (2018a) found the effect of rotation on the lifetimes of such objects to merit further study. The presence of internal magnetic fields, especially during the early formation phase, has been shown to promote the growth of metal-enriched SMSs (Hirano et al. 2023). The role of the Taylor-Spruit dynamo (Eggenberger et al. 2022) in the transport of angular momentum and chemical species inside accreting SMSs has not yet been investigated.
At accretion rates of 100–1000 M⊙ yr−1 the equations of stellar structure solved by GENEC and other codes such as MESA may no longer properly describe the buildup of the object, and a general relativistic hydrodynamics code coupled to nuclear burning may be required to determine the final fate of the gas. Stellar evolution codes produce a series of quasi-static snapshots of the structures of stars when in reality the growing object is the product of converging flows that compress gas on much smaller time steps. However, to evolve these accreting flows in GENEC we had to artificially restrict the time steps to hours or minutes to obtain numerical convergence, and evolving the equations of stellar structure on these timescales is not radically different than a full fluid flow solution. Our constraints on accretion rates for dark collapse, while approximate, are reasonable.
The Mayer & Bonoli (2019) merger scenario for the prompt formation of 109 M⊙ SMBHs at z > 6 invokes collisions between galaxies at z ∼ 8–10 that are already at solar metallicities to justify central infall rates of 102–105 M⊙ yr−1, but we have only considered primordial compositions here. Higher metallicities could change the critical accretion rate for dark collapse or even trigger explosions that are driven by rapid proton captures or explosive CNO burning (Nagele et al. 2023a). However, we found that the object encounters the GRI before central H burning in the absence of C, N, and O. At higher metallicities CNO burning occurs at lower temperatures and the situation may be different.
The actual age when MJ is 60 M⊙ is greater by nearly a factor 2 than the estimate from its KH time.
Acknowledgments
The authors thank Dr Lionel Haemmerlé for his help and interesting discussions. D.N., S.E. and G.M. have received funding from the European Research Council (ERC) under the European Union’s Horizon 2020 research and innovation programme (grant agreement No 833925, project STAREX). L.Z. acknowledges support from ERC Starting Grant No. 121817-BlackHoleMergs. G.M. has received funding from the SNF project 200020-212124.
References
- Abel, T., Bryan, G. L., & Norman, M. L. 2002, Science, 295, 93 [CrossRef] [Google Scholar]
- Agarwal, B., & Khochfar, S. 2015, MNRAS, 446, 160 [CrossRef] [Google Scholar]
- Baraffe, I., Heger, A., & Woosley, S. E. 2001, ApJ, 550, 890 [NASA ADS] [CrossRef] [Google Scholar]
- Barkat, Z., Rakavy, G., & Sack, N. 1967, Phys. Rev. Lett., 18, 379 [Google Scholar]
- Begelman, M. C., & Rees, M. J. 1978, MNRAS, 185, 847 [NASA ADS] [CrossRef] [Google Scholar]
- Behrend, R., & Maeder, A. 2001, A&A, 373, 190 [NASA ADS] [CrossRef] [EDP Sciences] [Google Scholar]
- Bernasconi, P. A., & Maeder, A. 1996, A&A, 307, 829 [NASA ADS] [Google Scholar]
- Boekholt, T. C. N., Schleicher, D. R. G., Fellhauer, M., et al. 2018, MNRAS, 476, 366 [Google Scholar]
- Bogdán, Á., Goulding, A. D., Natarajan, P., et al. 2023, Nat. Astron., 8, 126 [Google Scholar]
- Bromm, V., Coppi, P. S., & Larson, R. B. 1999, ApJ, 527, L5 [NASA ADS] [CrossRef] [PubMed] [Google Scholar]
- Chandrasekhar, S. 1964, ApJ, 140, 417 [Google Scholar]
- Chatzopoulos, E., & Wheeler, J. C. 2012, ApJ, 748, 42 [NASA ADS] [CrossRef] [Google Scholar]
- Chatzopoulos, E., Van Rossum, D. R., Craig, W. J., et al. 2015, ApJ, 799, 18 [NASA ADS] [CrossRef] [Google Scholar]
- Chen, K.-J., Heger, A., Woosley, S., et al. 2014a, ApJ, 790, 162 [CrossRef] [Google Scholar]
- Chen, K.-J., Woosley, S., Heger, A., Almgren, A., & Whalen, D. J. 2014b, ApJ, 792, 28 [NASA ADS] [CrossRef] [Google Scholar]
- Clark, P. C., Glover, S. C. O., Smith, R. J., et al. 2011, Science, 331, 1040 [Google Scholar]
- Devecchi, B., & Volonteri, M. 2009, ApJ, 694, 302 [NASA ADS] [CrossRef] [Google Scholar]
- Di Matteo, T., Khandai, N., DeGraf, C., et al. 2012, ApJ, 745, L29 [NASA ADS] [CrossRef] [Google Scholar]
- Eggenberger, P., Meynet, G., Maeder, A., et al. 2008, Ap&SS, 316, 43 [Google Scholar]
- Eggenberger, P., Moyano, F. D., & den Hartogh, J. W. 2022, A&A, 664, L16 [NASA ADS] [CrossRef] [EDP Sciences] [Google Scholar]
- Ekström, S., Georgy, C., Eggenberger, P., et al. 2012, A&A, 537, A146 [Google Scholar]
- Greif, T. H. 2015, Comput. Astrophys. Cosmol., 2, 3 [NASA ADS] [CrossRef] [Google Scholar]
- Greif, T. H., Springel, V., White, S. D. M., et al. 2011, ApJ, 737, 75 [NASA ADS] [CrossRef] [Google Scholar]
- Haemmerlé, L. 2020, A&A, 644, A154 [NASA ADS] [CrossRef] [EDP Sciences] [Google Scholar]
- Haemmerlé, L. 2021, A&A, 647, A83 [NASA ADS] [CrossRef] [EDP Sciences] [Google Scholar]
- Haemmerlé, L., Eggenberger, P., Meynet, G., Maeder, A., & Charbonnel, C. 2016, A&A, 585, A65 [NASA ADS] [CrossRef] [EDP Sciences] [Google Scholar]
- Haemmerlé, L., Woods, T. E., Klessen, R. S., Heger, A., & Whalen, D. J. 2018a, ApJ, 853, L3 [Google Scholar]
- Haemmerlé, L., Woods, T. E., Klessen, R. S., Heger, A., & Whalen, D. J. 2018b, MNRAS, 474, 2757 [Google Scholar]
- Haemmerlé, L., Klessen, R. S., Mayer, L., & Zwick, L. 2021, A&A, 652, L7 [NASA ADS] [CrossRef] [EDP Sciences] [Google Scholar]
- Heger, A., & Woosley, S. E. 2002, ApJ, 567, 532 [Google Scholar]
- Herrington, N. P., Whalen, D. J., & Woods, T. E. 2023, MNRAS, 521, 463 [CrossRef] [Google Scholar]
- Hirano, S., Hosokawa, T., Yoshida, N., et al. 2014, ApJ, 781, 60 [NASA ADS] [CrossRef] [Google Scholar]
- Hirano, S., Hosokawa, T., Yoshida, N., Omukai, K., & Yorke, H. W. 2015, MNRAS, 448, 568 [NASA ADS] [CrossRef] [Google Scholar]
- Hirano, S., Machida, M. N., & Basu, S. 2023, ApJ, 952, 56 [NASA ADS] [CrossRef] [Google Scholar]
- Hosokawa, T., Omukai, K., Yoshida, N., & Yorke, H. W. 2011, Science, 334, 1250 [CrossRef] [Google Scholar]
- Hosokawa, T., Yorke, H. W., Inayoshi, K., Omukai, K., & Yoshida, N. 2013, ApJ, 778, 178 [Google Scholar]
- Katz, H., Sijacki, D., & Haehnelt, M. G. 2015, MNRAS, 451, 2352 [Google Scholar]
- Kitayama, T., Yoshida, N., Susa, H., & Umemura, M. 2004, ApJ, 613, 631 [NASA ADS] [CrossRef] [Google Scholar]
- Klessen, R. S., & Glover, S. C. O. 2023, ARA&A, 61, 65 [NASA ADS] [CrossRef] [Google Scholar]
- Kudritzki, R. 2000, in The First Stars,, A. Weiss, T. G. Abel, & V. Hill, 127 [CrossRef] [Google Scholar]
- Latif, M. A., Bovino, S., Grassi, T., Schleicher, D. R. G., & Spaans, M. 2015, MNRAS, 446, 3163 [CrossRef] [Google Scholar]
- Latif, M. A., Khochfar, S., Schleicher, D., & Whalen, D. J. 2021, MNRAS, 508, 1756 [NASA ADS] [CrossRef] [Google Scholar]
- Latif, M. A., Whalen, D., & Khochfar, S. 2022a, ApJ, 925, 28 [NASA ADS] [CrossRef] [Google Scholar]
- Latif, M. A., Whalen, D. J., Khochfar, S., Herrington, N. P., & Woods, T. E. 2022b, Nature, 607, 48 [CrossRef] [Google Scholar]
- Leung, S.-C., Nomoto, K., & Blinnikov, S. 2019, ApJ, 887, 72 [Google Scholar]
- Maeder, A., & Meynet, G. 2000, A&A, 361, 159 [NASA ADS] [Google Scholar]
- Maiolino, R., Scholtz, J., Witstok, J., et al. 2023, ArXiv e-prints [arXiv:2305.12492] [Google Scholar]
- Mayer, L., & Bonoli, S. 2019, Rep. Prog. Phys., 82, 016901 [Google Scholar]
- Mayer, L., Kazantzidis, S., Escala, A., & Callegari, S. 2010, Nature, 466, 1082 [Google Scholar]
- Murphy, L. J., Groh, J. H., Ekström, S., et al. 2021, MNRAS, 501, 2745 [NASA ADS] [CrossRef] [Google Scholar]
- Nagele, C., Umeda, H., Takahashi, K., Yoshida, T., & Sumiyoshi, K. 2022, MNRAS, 517, 1584 [NASA ADS] [CrossRef] [Google Scholar]
- Nagele, C., Umeda, H., & Takahashi, K. 2023a, MNRAS, 523, 1629 [NASA ADS] [CrossRef] [Google Scholar]
- Nagele, C., Umeda, H., Takahashi, K., & Maeda, K. 2023b, MNRAS, 520, L72 [Google Scholar]
- Nakamura, F., & Umemura, M. 2001, ApJ, 548, 19 [NASA ADS] [CrossRef] [Google Scholar]
- Nandal, D., Regan, J. A., Woods, T. E., et al. 2023, A&A, 677, A155 [NASA ADS] [CrossRef] [EDP Sciences] [Google Scholar]
- Nandal, D., Farrell, E., Buldgen, G., Meynet, G., & Ekstrom, S. 2024, A&A, 685, A159 [NASA ADS] [CrossRef] [EDP Sciences] [Google Scholar]
- Omukai, K., & Palla, F. 2001, ApJ, 561, L55 [NASA ADS] [CrossRef] [Google Scholar]
- Omukai, K., & Palla, F. 2003, ApJ, 589, 677 [NASA ADS] [CrossRef] [Google Scholar]
- Patrick, S. J., Whalen, D. J., Latif, M. A., & Elford, J. S. 2023, MNRAS, 522, 3795 [NASA ADS] [CrossRef] [Google Scholar]
- Paxton, B., Bildsten, L., Dotter, A., et al. 2011, ApJS, 192, 3 [Google Scholar]
- Paxton, B., Cantiello, M., Arras, P., et al. 2013, ApJS, 208, 4 [Google Scholar]
- Paxton, B., Schwab, J., Bauer, E. B., et al. 2018, ApJS, 234, 34 [NASA ADS] [CrossRef] [Google Scholar]
- Prole, L. R., Regan, J. A., Glover, S. C. O., et al. 2024, A&A, 685, A31 [NASA ADS] [CrossRef] [EDP Sciences] [Google Scholar]
- Rakavy, G., & Shaviv, G. 1967, ApJ, 148, 803 [Google Scholar]
- Regan, J. A., & Downes, T. P. 2018, MNRAS, 478, 5037 [NASA ADS] [CrossRef] [Google Scholar]
- Regan, J. A., Wise, J. H., Woods, T. E., et al. 2020, Open J. Astrophys., 3, 15 [NASA ADS] [Google Scholar]
- Reinoso, B., Schleicher, D. R. G., Fellhauer, M., Klessen, R. S., & Boekholt, T. C. N. 2018, A&A, 614, A14 [NASA ADS] [CrossRef] [EDP Sciences] [Google Scholar]
- Saio, H., Nandal, D., Ekstroem, S., & Meynet, G. 2024, A&A, 689, A169 [NASA ADS] [CrossRef] [EDP Sciences] [Google Scholar]
- Sakurai, Y., Hosokawa, T., Yoshida, N., & Yorke, H. W. 2015, MNRAS, 452, 755 [Google Scholar]
- Sakurai, Y., Vorobyov, E. I., Hosokawa, T., et al. 2016, MNRAS, 459, 1137 [NASA ADS] [CrossRef] [Google Scholar]
- Sakurai, Y., Yoshida, N., Fujii, M. S., & Hirano, S. 2017, MNRAS, 472, 1677 [NASA ADS] [CrossRef] [Google Scholar]
- Smidt, J., Whalen, D. J., Chatzopoulos, E., et al. 2015, ApJ, 805, 44 [NASA ADS] [CrossRef] [Google Scholar]
- Smidt, J., Whalen, D. J., Johnson, J. L., Surace, M., & Li, H. 2018, ApJ, 865, 126 [NASA ADS] [CrossRef] [Google Scholar]
- Stahler, S. W., Palla, F., & Salpeter, E. E. 1986, ApJ, 308, 697 [NASA ADS] [CrossRef] [Google Scholar]
- Suazo, M., Prieto, J., Escala, A., & Schleicher, D. R. G. 2019, ApJ, 885, 127 [NASA ADS] [CrossRef] [Google Scholar]
- Sugimura, K., Omukai, K., & Inoue, A. K. 2014, MNRAS, 445, 544 [NASA ADS] [CrossRef] [Google Scholar]
- Umeda, H., Hosokawa, T., Omukai, K., & Yoshida, N. 2016, ApJ, 830, L34 [Google Scholar]
- Vink, J. S., de Koter, A., & Lamers, H. J. G. L. M. 2001, A&A, 369, 574 [NASA ADS] [CrossRef] [EDP Sciences] [Google Scholar]
- Whalen, D., Abel, T., & Norman, M. L. 2004, ApJ, 610, 14 [NASA ADS] [CrossRef] [Google Scholar]
- Whalen, D. J., Even, W., Frey, L. H., et al. 2013a, ApJ, 777, 110 [NASA ADS] [CrossRef] [Google Scholar]
- Whalen, D. J., Fryer, C. L., Holz, D. E., et al. 2013b, ApJ, 762, L6 [NASA ADS] [CrossRef] [Google Scholar]
- Whalen, D. J., Smidt, J., Even, W., et al. 2014, ApJ, 781, 106 [NASA ADS] [CrossRef] [Google Scholar]
- Woods, T. E., Heger, A., Whalen, D. J., Haemmerlé, L., & Klessen, R. S. 2017, ApJ, 842, L6 [Google Scholar]
- Woods, T. E., Patrick, S., Elford, J. S., Whalen, D. J., & Heger, A. 2021, ApJ, 915, 110 [NASA ADS] [CrossRef] [Google Scholar]
- Woods, T. E., Patrick, S., Whalen, D. J., & Heger, A. 2024, ApJ, 960, 59 [NASA ADS] [CrossRef] [Google Scholar]
- Woosley, S. E. 2017, ApJ, 836, 244 [Google Scholar]
- Woosley, S. E., Blinnikov, S., & Heger, A. 2007, Nature, 450, 390 [NASA ADS] [CrossRef] [PubMed] [Google Scholar]
- Yoshida, N., Omukai, K., Hernquist, L., & Abel, T. 2006, ApJ, 652, 6 [NASA ADS] [CrossRef] [Google Scholar]
- Zwick, L., Mayer, L., Haemmerlé, L., & Klessen, R. S. 2023, MNRAS, 518, 2076 [Google Scholar]
All Tables
All Figures
|
Fig. 1. HR diagram of massive and supermassive stars at zero metallicity at accretion rates of 10−6 M⊙ yr−1 to 103 M⊙ yr−1. The background colors indicate radii in units of solar radius. The blue line represents the Z = 0 ZAMS track with red dots marking masses in solar units. The tracks are labelled by accretion rate in black. The black dots indicate the end point of computation which corresponds to end of core Silicon burning for accretion rates up to 10−2 M⊙ yr−1 and the onset of GR instability for higher accretion rates. |
| In the text | |
|
Fig. 2. Evolution of the total radius as a function of growing mass at accretion rates of 10−2 M⊙ yr−1 (left panel), 1 M⊙ yr−1 (centre panel) and 103 M⊙ yr−1 (right panel) shown in Kippenhahn diagrams. |
| In the text | |
|
Fig. 3. The distribution of physical parameters and abundances of a 0.1 M⊙/yr model just before the end of evolution. Left panel: Log T versus log R plot for the 0.1 M⊙/yr model at the end of its evolution upon encountering GR instability at a mass of 108 000 M⊙. The blue zones indicate convective zones and grey zones correspond to radiative zones. The enclosed mass is indicated at different radii (see the numbers at red points). Most of the mass (105 000 M⊙) is within a radius of 1013 cm or 14.0 R⊙ that represents 1% of the total radius. Only a fraction of mass (still 23 000 M⊙) in the outer envelope implying the star is extremely bloated. Right panel: The plot depicts the change in abundance of various elements inside the 0.1 M⊙/yr model upon encountering the GR instability when central mass fraction of hydrogen is 0.244. |
| In the text | |
|
Fig. 4. Variation of luminosity (in mass fraction) as a function of mass coordinate inside two accreting models compared at same total luminosity. Left: total (solid), nuclear (dotted) and gravitational (dashed) luminosities versus enclosed mass fraction for the 10−3 M⊙ yr−1 star at a mass of 2072 M⊙ and total luminosity of 6.9 × 10⁷ L⊙. Right: Same as on the left but for a pre-MS 1.0 M⊙ yr−1 star at a mass of 2337 M⊙ and same total luminosity (in this case powered only by gravitational contraction). The dot-dashed lines show mass fractions for H (left) and 3He (right) in the star. The shaded blue and grey zones depict the convective and radiative regions respectively. |
| In the text | |
|
Fig. 5. Final mass versus accretion rate for 10−6 M⊙ yr−1 to 103 M⊙ yr−1. The gold line is for zero metallicity models, the silver line is for Z = 10−6 Z⊙ and the single dot at 1 M⊙ yr−1 is the solar metallicity model. The green bar marks the final mass range for which collapse occurs after core Si burning and the red bar is the mass range for which the GRI triggers collapse during central H burning. The vertical pair instability strip spans 150–250 M⊙ and is for the non accreting models while 7–150 M⊙ progenitors produce neutron stars or stellar-mass BHs. The oval shapes with numbers correspond to the central mass fraction of hydrogen at the time GRI is triggered. |
| In the text | |
|
Fig. 6. Birthlines for a few accretion rates and metallicities. Left: the dashed red line is for the variable accretion rate from a hydrodynamical simulation of a Pop III star by Yoshida et al. (2006). The solid black track is the 10−5 M⊙ yr−1 solar metallicity model. The short dashed green track is the 10−5 M⊙ yr−1 zero-metallicity model. The black circles and triangles mark the beginning and end of core hydrogen burning, respectively. Masses at the end of hydrogen burning are shown at the end of each track. The solid blue and yellow numbered dots and their masses (in M⊙) are non-accreting ZAMS stars at zero and solar metallicity from Murphy et al. (2021) and Ekström et al. (2012), respectively. The grey dotted lines are iso-radii for the indicated radii. Right: birthlines for Pop III (black) and solar metallicity (red) stars with a constant accretion rate of 10−3 M⊙ yr−1. The solid black and red numbered dots and their masses (in M⊙) are again the stars at zero and solar metallicity from Murphy et al. (2021) and Ekström et al. (2012), respectively, for comparison. |
| In the text | |
|
Fig. 7. HR diagram of 1 M⊙ yr−1 SMS models at three metallicities of Z = 0 (black line), Z = 10−6 (red) and Z = solar (green). |
| In the text | |
|
Fig. 8. Densities, temperatures and energy generation rates as functions of enclosed mass and radius for 1 M⊙ yr−1 stars at zero (left), 10−6 (centre) and solar (right) metallicities. The light blue and light grey regions indicate the convective and radiative zones respectively. |
| In the text | |
Current usage metrics show cumulative count of Article Views (full-text article views including HTML views, PDF and ePub downloads, according to the available data) and Abstracts Views on Vision4Press platform.
Data correspond to usage on the plateform after 2015. The current usage metrics is available 48-96 hours after online publication and is updated daily on week days.
Initial download of the metrics may take a while.